Wells Fargo 2015 Annual Report Download - page 51
Download and view the complete annual report
Please find page 51 of the 2015 Wells Fargo annual report below. You can navigate through the pages in the report by either clicking on the pages listed below, or by using the keyword search tool below to find specific information within the annual report.-
 1
1 -
2
-
3
-
4
-
5
-
6
-
7
-
8
-
9
-
10
-
11
-
12
-
13
-
14
-
15
-
16
-
17
-
18
-
19
-
20
-
21
-
22
-
23
-
24
-
25
-
26
-
27
-
28
-
29
-
30
-
31
-
32
-
33
-
34
-
35
-
36
-
37
-
38
-
39
-
40
-
 41
41 -
 42
42 -
 43
43 -
 44
44 -
 45
45 -
 46
46 -
 47
47 -
 48
48 -
 49
49 -
 50
50 -
 51
51 -
 52
52 -
 53
53 -
 54
54 -
 55
55 -
 56
56 -
 57
57 -
 58
58 -
 59
59 -
 60
60 -
 61
61 -
62
-
63
-
64
-
65
-
66
-
67
-
68
-
69
-
70
-
71
-
72
-
73
-
74
-
75
-
76
-
77
-
78
-
79
-
80
-
81
-
82
-
83
-
84
-
85
-
86
-
87
-
88
-
89
-
90
-
91
-
92
-
93
-
94
-
95
-
96
-
97
-
98
-
99
-
100
-
101
-
102
-
103
-
104
-
105
-
106
-
107
-
108
-
109
-
110
-
111
-
112
-
113
-
114
-
115
-
116
-
117
-
118
-
119
-
120
-
121
-
122
-
123
-
124
-
125
-
126
-
127
-
128
-
129
-
130
-
131
-
132
-
133
-
134
-
135
-
136
-
137
-
138
-
139
-
140
-
141
-
142
-
143
-
144
-
145
-
146
-
147
-
148
-
149
-
150
-
151
-
152
-
153
-
154
-
155
-
156
-
157
-
158
-
159
-
160
-
161
-
162
-
163
-
164
-
165
-
166
-
167
-
168
-
169
-
170
-
171
-
172
-
173
-
174
-
175
-
176
-
177
-
178
-
179
-
180
-
181
-
182
-
183
-
184
-
185
-
186
-
187
-
188
-
189
-
190
-
191
-
192
-
193
-
194
-
195
-
196
-
197
-
198
-
199
-
200
-
201
-
202
-
203
-
204
-
205
-
206
-
207
-
208
-
209
-
210
-
211
-
212
-
213
-
214
-
215
-
216
-
217
-
218
-
219
-
220
-
221
-
222
-
223
-
224
-
225
-
226
-
227
-
228
-
229
-
230
-
231
-
232
-
233
-
234
-
235
-
236
-
237
-
238
-
239
-
240
-
241
-
242
-
243
-
244
-
245
-
246
-
247
-
248
-
249
-
250
-
251
-
252
-
253
-
254
-
255
-
256
-
257
-
258
-
259
-
260
-
261
-
262
-
263
-
264
-
265
-
266
-
267
-
268
-
269
-
270
-
271
-
272
-
273
 |
 |

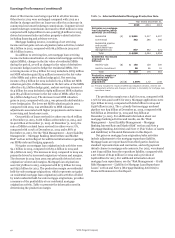
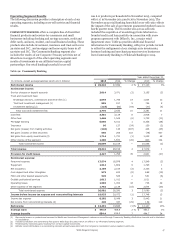
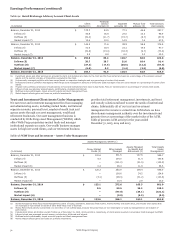
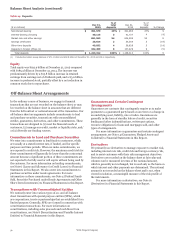
Table 9b: Wholesale Banking
Year ended December 31,
(in millions, except average balances which are in billions) 2015 2014 % Change 2013 % Change
Net interest income $ 14,350 14,073 2 % $ 14,353 (2)%
Noninterest income:
Service charges on deposit accounts 2,153 1,978 9 1,867 6
Trust and investment fees:
Brokerage advisory, commissions and other fees 285 255 12 195 31
Trust and investment management 407 374 9 411 (9)
Investment banking 1,762 1,803 (2) 1,839 (2)
Total trust and investment fees 2,454 2,432 1 2,445 (1)
Card fees 337 310 9 271 14
Other fees 2,872 2,798 3 2,599 8
Mortgage banking 447 370 21 425 (13)
Insurance 1,598 1,528 5 1,684 (9)
Net gains from trading activities 719 886 (19) 1,092 (19)
Net gains (losses) on debt securities 396 334 19 48 596
Net gains from equity investments 511 624 (18) 420 49
Other income of the segment 67 65 3 643 (90)
Total noninterest income 11,554 11,325 2 11,494 (1)
Total revenue 25,904 25,398 2 25,847 (2)
Provision (reversal of provision) for credit losses 27 (382) 107 (521) 27
Noninterest expense:
Personnel expense 6,936 6,660 4 6,398 4
Equipment 97 106 (8) 123 (14)
Net occupancy 452 446 1 455 (2)
Core deposit and other intangibles 347 391 (11) 423 (8)
FDIC and other deposit assessments 352 328 7 320 3
Outside professional services 837 834 — 759 10
Operating losses 152 70 117 26 169
Other expense of the segment 4,943 4,996 (1) 4,573 9
Total noninterest expense 14,116 13,831 2 13,077 6
Income before income tax expense and noncontrolling interest 11,761 11,949 (2) 13,291 (10)
Income tax expense 3,424 3,540 (3) 4,364 (19)
Net income from noncontrolling interest 143 210 (32) 175 20
Net income $ 8,194 8,199 — % $ 8,752 (6)%
Average loans $ 397.3 355.6 12 % $ 329.0 8 %
Average deposits 438.9 404.0 9 353.8 14
Wholesale Banking reported net income of $8.2 billion in
2015, down $5 million from 2014, which was down 6% from
$8.8 billion in 2013. The year over year decrease in net income
for 2015 was the result of increased revenues being more than
offset by increased noninterest expense and higher loan loss
provision. The year over year decrease in net income during
2014 compared with 2013 was the result of lower revenues,
increased noninterest expense and higher provision for credit
losses. Revenue in 2015 of $25.9 billion increased $506 million,
or 2%, from $25.4 billion in 2014, on growth in Wells Fargo
Securities' markets division, treasury management, asset backed
finance, principal investing, commercial real estate brokerage,
multi-family capital, reinsurance, and municipal products.
Revenue in 2014 of $25.4 billion decreased $449 million, or 2%,
from $25.8 billion in 2013, as growth in asset backed finance,
commercial real estate brokerage, corporate banking, equipment
finance, international, principal investing and treasury
management was more than offset by lower PCI resolution
income as well as lower crop insurance fee income. Net interest
income of $14.4 billion in 2015 increased $277 million, or 2%,
from 2014, which was down 2% from 2013. The increase in 2015
was due to strong loan and other earning asset growth. The
decrease in 2014 was due to lower PCI resolution income and net
interest margin compression due to declining loan yields and
fees that was partially offset by increased interest income
primarily from strong loan growth. Average loans of
$397.3 billion in 2015 increased $41.7 billion, or 12%, from
$355.6 billion in 2014, which was up 8% from $329.0 billion in
2013. Loan growth in 2015 and 2014 was broad based across
many Wholesale Banking businesses. Average deposits of
$438.9 billion in 2015 increased $34.9 billion, or 9%, from 2014
which was up 14% from 2013, reflecting continued strong
customer liquidity for both years. Noninterest income of
$11.6 billion in 2015 increased $229 million, or 2%, from 2014
driven by growth in treasury management, reinsurance,
commercial real estate brokerage fees, multi-family capital,
municipal products, principal investing, corporate trust and
business banking, partially offset by lower customer
Wells Fargo & Company
49