Wells Fargo 2015 Annual Report Download - page 187
Download and view the complete annual report
Please find page 187 of the 2015 Wells Fargo annual report below. You can navigate through the pages in the report by either clicking on the pages listed below, or by using the keyword search tool below to find specific information within the annual report.-
 1
1 -
2
-
3
-
4
-
5
-
6
-
7
-
8
-
9
-
10
-
11
-
12
-
13
-
14
-
15
-
16
-
17
-
18
-
19
-
20
-
21
-
22
-
23
-
24
-
25
-
26
-
27
-
28
-
29
-
30
-
31
-
32
-
33
-
34
-
35
-
36
-
37
-
38
-
39
-
40
-
41
-
42
-
43
-
44
-
45
-
46
-
47
-
48
-
49
-
50
-
51
-
52
-
53
-
54
-
55
-
56
-
57
-
58
-
59
-
60
-
61
-
62
-
63
-
64
-
65
-
66
-
67
-
68
-
69
-
70
-
71
-
72
-
73
-
74
-
75
-
76
-
77
-
78
-
79
-
80
-
81
-
82
-
83
-
84
-
85
-
86
-
87
-
88
-
89
-
90
-
91
-
92
-
93
-
94
-
95
-
96
-
97
-
98
-
99
-
100
-
101
-
102
-
103
-
104
-
105
-
106
-
107
-
108
-
109
-
110
-
111
-
112
-
113
-
114
-
115
-
116
-
117
-
118
-
119
-
120
-
121
-
122
-
123
-
124
-
125
-
126
-
127
-
128
-
129
-
130
-
131
-
132
-
133
-
134
-
135
-
136
-
137
-
138
-
139
-
140
-
141
-
142
-
143
-
144
-
145
-
146
-
147
-
148
-
149
-
150
-
151
-
152
-
153
-
154
-
155
-
156
-
157
-
158
-
159
-
160
-
161
-
162
-
163
-
164
-
165
-
166
-
167
-
168
-
169
-
170
-
171
-
172
-
173
-
174
-
175
-
176
-
 177
177 -
 178
178 -
 179
179 -
 180
180 -
 181
181 -
 182
182 -
 183
183 -
 184
184 -
 185
185 -
 186
186 -
 187
187 -
 188
188 -
 189
189 -
 190
190 -
 191
191 -
 192
192 -
 193
193 -
 194
194 -
 195
195 -
 196
196 -
 197
197 -
198
-
199
-
200
-
201
-
202
-
203
-
204
-
205
-
206
-
207
-
208
-
209
-
210
-
211
-
212
-
213
-
214
-
215
-
216
-
217
-
218
-
219
-
220
-
221
-
222
-
223
-
224
-
225
-
226
-
227
-
228
-
229
-
230
-
231
-
232
-
233
-
234
-
235
-
236
-
237
-
238
-
239
-
240
-
241
-
242
-
243
-
244
-
245
-
246
-
247
-
248
-
249
-
250
-
251
-
252
-
253
-
254
-
255
-
256
-
257
-
258
-
259
-
260
-
261
-
262
-
263
-
264
-
265
-
266
-
267
-
268
-
269
-
270
-
271
-
272
-
273
 |
 |

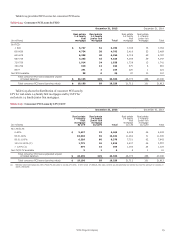
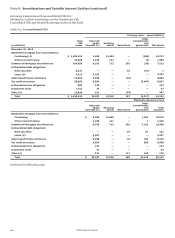
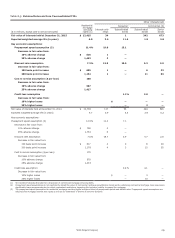
(continued from previous page)
Carrying value - asset (liability)
Other
Total Debt and commitments
VIE equity Servicing and
(in millions) assets interests (1) assets Derivatives guarantees Net assets
December 31, 2014
Residential mortgage loan securitizations:
Conforming (2) $ 1,268,200 2,846 11,684 — (581) 13,949
Other/nonconforming 32,213 1,644 209 — (8) 1,845
Commercial mortgage securitizations 196,510 8,756 650 251 (32) 9,625
Collateralized debt obligations:
Debt securities 5,039 11 — 163 (105) 69
Loans (3) 5,347 5,221 — — — 5,221
Asset-based finance structures 18,954 13,044 — (71) — 12,973
Tax credit structures 22,859 7,809 — — (2,585) 5,224
Collateralized loan obligations 1,251 518 — — — 518
Investment funds 2,764 49 — — — 49
Other (4) 12,912 747 19 (18) (5) 743
Total $ 1,566,049 40,645 12,562 325 (3,316) 50,216
Maximum exposure to loss
Other
Debt and commitments
equity Servicing and Total
interests (1) assets Derivatives guarantees exposure
Residential mortgage loan securitizations:
Conforming $ 2,846 11,684 — 2,507 17,037
Other/nonconforming 1,644 209 — 345 2,198
Commercial mortgage securitizations 8,756 650 251 5,715 15,372
Collateralized debt obligations:
Debt securities 11 — 163 105 279
Loans (3) 5,221 — — — 5,221
Asset-based finance structures 13,044 — 89 656 13,789
Tax credit structures 7,809 — — 725 8,534
Collateralized loan obligations 518 — — 38 556
Investment funds 49 — — — 49
Other (4) 747 19 150 156 1,072
Total $ 40,645 12,562 653 10,247 64,107
(1) Includes total equity interests of $8.9 billion and $8.1 billion at December 31, 2015 and 2014, respectively. Also includes debt interests in the form of both loans and
securities. Excludes certain debt securities held related to loans serviced for FNMA, FHLMC and GNMA.
(2) Excludes assets and related liabilities with a recorded carrying value on our balance sheet of $1.3 billion and $1.7 billion at December 31, 2015 and 2014, respectively, for
certain delinquent loans that are eligible for repurchase primarily from GNMA loan securitizations. The recorded carrying value represents the amount that would be
payable if the Company was to exercise the repurchase option. The carrying amounts are excluded from the table because the loans eligible for repurchase do not
represent interests in the VIEs.
(3) Represents senior loans to trusts that are collateralized by asset-backed securities. The trusts invest primarily in senior tranches from a diversified pool of primarily U.S.
asset securitizations, of which all are current and 70% were rated as investment grade by the primary rating agencies at both December 31, 2015 and 2014. These senior
loans are accounted for at amortized cost and are subject to the Company’s allowance and credit charge-off policies.
(4) Includes structured financing and credit-linked note structures. Also contains investments in auction rate securities (ARS) issued by VIEs that we do not sponsor and,
accordingly, are unable to obtain the total assets of the entity.
In the two preceding tables, “Total VIE assets” represents that would be incurred under severe, hypothetical
the remaining principal balance of assets held by unconsolidated circumstances, for which we believe the possibility is extremely
VIEs using the most current information available. For VIEs that remote, such as where the value of our interests and any
obtain exposure to assets synthetically through derivative associated collateral declines to zero, without any consideration
instruments, the remaining notional amount of the derivative is of recovery or offset from any economic hedges. Accordingly,
included in the asset balance. “Carrying value” is the amount in this required disclosure is not an indication of expected loss.
our consolidated balance sheet related to our involvement with
the unconsolidated VIEs. “Maximum exposure to loss” from our RESIDENTIAL MORTGAGE LOANS Residential mortgage loan
involvement with off-balance sheet entities, which is a required securitizations are financed through the issuance of fixed-rate or
disclosure under GAAP, is determined as the carrying value of floating-rate asset-backed securities, which are collateralized by
our involvement with off-balance sheet (unconsolidated) VIEs the loans transferred to a VIE. We typically transfer loans we
plus the remaining undrawn liquidity and lending commitments, originated to these VIEs, account for the transfers as sales, retain
the notional amount of net written derivative contracts, and the right to service the loans and may hold other beneficial
generally the notional amount of, or stressed loss estimate for, interests issued by the VIEs. We also may be exposed to limited
other commitments and guarantees. It represents estimated loss liability related to recourse agreements and repurchase
Wells Fargo & Company
185