Wells Fargo 2015 Annual Report Download - page 105
Download and view the complete annual report
Please find page 105 of the 2015 Wells Fargo annual report below. You can navigate through the pages in the report by either clicking on the pages listed below, or by using the keyword search tool below to find specific information within the annual report.-
 1
1 -
2
-
3
-
4
-
5
-
6
-
7
-
8
-
9
-
10
-
11
-
12
-
13
-
14
-
15
-
16
-
17
-
18
-
19
-
20
-
21
-
22
-
23
-
24
-
25
-
26
-
27
-
28
-
29
-
30
-
31
-
32
-
33
-
34
-
35
-
36
-
37
-
38
-
39
-
40
-
41
-
42
-
43
-
44
-
45
-
46
-
47
-
48
-
49
-
50
-
51
-
52
-
53
-
54
-
55
-
56
-
57
-
58
-
59
-
60
-
61
-
62
-
63
-
64
-
65
-
66
-
67
-
68
-
69
-
70
-
71
-
72
-
73
-
74
-
75
-
76
-
77
-
78
-
79
-
80
-
81
-
82
-
83
-
84
-
85
-
86
-
87
-
88
-
89
-
90
-
91
-
92
-
93
-
94
-
 95
95 -
 96
96 -
 97
97 -
 98
98 -
 99
99 -
 100
100 -
 101
101 -
 102
102 -
 103
103 -
 104
104 -
 105
105 -
 106
106 -
 107
107 -
 108
108 -
 109
109 -
 110
110 -
 111
111 -
 112
112 -
 113
113 -
 114
114 -
 115
115 -
116
-
117
-
118
-
119
-
120
-
121
-
122
-
123
-
124
-
125
-
126
-
127
-
128
-
129
-
130
-
131
-
132
-
133
-
134
-
135
-
136
-
137
-
138
-
139
-
140
-
141
-
142
-
143
-
144
-
145
-
146
-
147
-
148
-
149
-
150
-
151
-
152
-
153
-
154
-
155
-
156
-
157
-
158
-
159
-
160
-
161
-
162
-
163
-
164
-
165
-
166
-
167
-
168
-
169
-
170
-
171
-
172
-
173
-
174
-
175
-
176
-
177
-
178
-
179
-
180
-
181
-
182
-
183
-
184
-
185
-
186
-
187
-
188
-
189
-
190
-
191
-
192
-
193
-
194
-
195
-
196
-
197
-
198
-
199
-
200
-
201
-
202
-
203
-
204
-
205
-
206
-
207
-
208
-
209
-
210
-
211
-
212
-
213
-
214
-
215
-
216
-
217
-
218
-
219
-
220
-
221
-
222
-
223
-
224
-
225
-
226
-
227
-
228
-
229
-
230
-
231
-
232
-
233
-
234
-
235
-
236
-
237
-
238
-
239
-
240
-
241
-
242
-
243
-
244
-
245
-
246
-
247
-
248
-
249
-
250
-
251
-
252
-
253
-
254
-
255
-
256
-
257
-
258
-
259
-
260
-
261
-
262
-
263
-
264
-
265
-
266
-
267
-
268
-
269
-
270
-
271
-
272
-
273
 |
 |

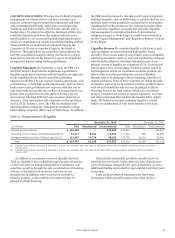
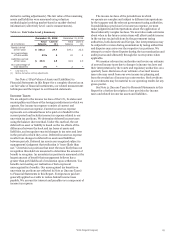
Requirements) to Financial Statements in this Report.
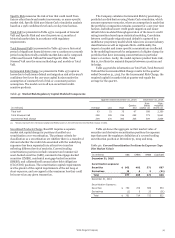
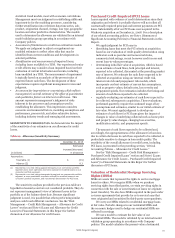
Table 55 summarizes our Basel III CET1, tier 1 capital, total
capital, risk-weighted assets and capital ratios on a fully phased-
in basis at December 31, 2015 and 2014. As of December 31,
2015, our CET1 ratio was lower using RWAs calculated under the
Standardized Approach.
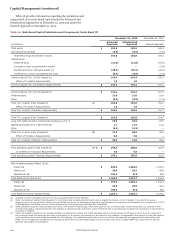
Table 55: Capital Components and Ratios Under Basel III (Fully Phased-In) (1)
December 31, 2015 December 31, 2014
Standardized
(in billions) Advanced Approach Approach General Approach
Common Equity Tier 1 (A) $ 142.4 142.4 137.1
Tier 1 Capital (B) 162.8 162.8 154.7
Total Capital (C) 190.4 200.8 192.9
Risk-Weighted Assets (D) 1,282.8 1,321.7 1,242.5
Common Equity Tier 1 Capital Ratio (A)/(D) 11.10% 10.77 * 11.04
Tier 1 Capital Ratio (B)/(D) 12.69 12.32 * 12.45
Total Capital Ratio (C)/(D) 14.84 * 15.19 15.53
*Denotes the lowest capital ratio as determined under the Basel III Advanced and Standardized Approaches.
(1) Fully phased-in regulatory capital amounts, ratios and RWAs are considered non-GAAP financial measures that are used by management, bank regulatory agencies,
investors and analysts to assess and monitor the Company’s capital position. See Table 56 for information regarding the calculation and components of CET1, Tier 1 capital,
total capital and RWAs, as well as the corresponding reconciliation of our regulatory capital amounts to total equity.
Wells Fargo & Company
103