Wells Fargo 2015 Annual Report Download - page 66
Download and view the complete annual report
Please find page 66 of the 2015 Wells Fargo annual report below. You can navigate through the pages in the report by either clicking on the pages listed below, or by using the keyword search tool below to find specific information within the annual report.-
 1
1 -
2
-
3
-
4
-
5
-
6
-
7
-
8
-
9
-
10
-
11
-
12
-
13
-
14
-
15
-
16
-
17
-
18
-
19
-
20
-
21
-
22
-
23
-
24
-
25
-
26
-
27
-
28
-
29
-
30
-
31
-
32
-
33
-
34
-
35
-
36
-
37
-
38
-
39
-
40
-
41
-
42
-
43
-
44
-
45
-
46
-
47
-
48
-
49
-
50
-
51
-
52
-
53
-
54
-
55
-
 56
56 -
 57
57 -
 58
58 -
 59
59 -
 60
60 -
 61
61 -
 62
62 -
 63
63 -
 64
64 -
 65
65 -
 66
66 -
 67
67 -
 68
68 -
 69
69 -
 70
70 -
 71
71 -
 72
72 -
 73
73 -
 74
74 -
 75
75 -
 76
76 -
77
-
78
-
79
-
80
-
81
-
82
-
83
-
84
-
85
-
86
-
87
-
88
-
89
-
90
-
91
-
92
-
93
-
94
-
95
-
96
-
97
-
98
-
99
-
100
-
101
-
102
-
103
-
104
-
105
-
106
-
107
-
108
-
109
-
110
-
111
-
112
-
113
-
114
-
115
-
116
-
117
-
118
-
119
-
120
-
121
-
122
-
123
-
124
-
125
-
126
-
127
-
128
-
129
-
130
-
131
-
132
-
133
-
134
-
135
-
136
-
137
-
138
-
139
-
140
-
141
-
142
-
143
-
144
-
145
-
146
-
147
-
148
-
149
-
150
-
151
-
152
-
153
-
154
-
155
-
156
-
157
-
158
-
159
-
160
-
161
-
162
-
163
-
164
-
165
-
166
-
167
-
168
-
169
-
170
-
171
-
172
-
173
-
174
-
175
-
176
-
177
-
178
-
179
-
180
-
181
-
182
-
183
-
184
-
185
-
186
-
187
-
188
-
189
-
190
-
191
-
192
-
193
-
194
-
195
-
196
-
197
-
198
-
199
-
200
-
201
-
202
-
203
-
204
-
205
-
206
-
207
-
208
-
209
-
210
-
211
-
212
-
213
-
214
-
215
-
216
-
217
-
218
-
219
-
220
-
221
-
222
-
223
-
224
-
225
-
226
-
227
-
228
-
229
-
230
-
231
-
232
-
233
-
234
-
235
-
236
-
237
-
238
-
239
-
240
-
241
-
242
-
243
-
244
-
245
-
246
-
247
-
248
-
249
-
250
-
251
-
252
-
253
-
254
-
255
-
256
-
257
-
258
-
259
-
260
-
261
-
262
-
263
-
264
-
265
-
266
-
267
-
268
-
269
-
270
-
271
-
272
-
273
 |
 |

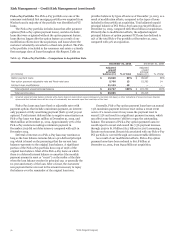
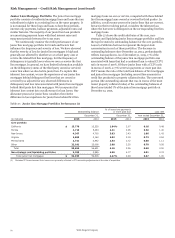
Risk Management – Credit Risk Management (continued)
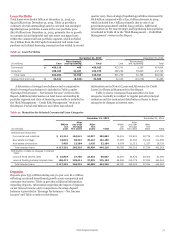
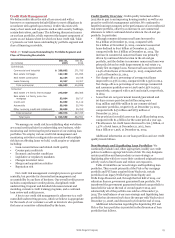
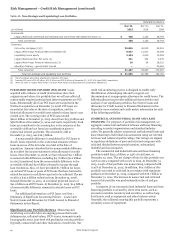
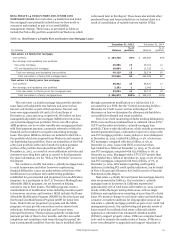
Table 18: Non-Strategic and Liquidating Loan Portfolios
Outstanding balance
Dec 31, Dec 31, Dec 31,
(in millions) 2015 2014 2008
Commercial:
Legacy Wachovia commercial and industrial and commercial real estate PCI loans (1) $ 468 1,125 18,704
Total commercial 468 1,125 18,704
Consumer:
Pick-a-Pay mortgage (1)(2) 39,065 45,002 95,315
Legacy Wells Fargo Financial debt consolidation (3) 9,957 11,417 25,299
Liquidating home equity 2,234 2,910 10,309
Legacy Wachovia other PCI loans (1) 221 300 2,478
Legacy Wells Fargo Financial indirect auto (3) 10 34 18,221
Education Finance – government insured — — 20,465
Total consumer 51,487 59,663 172,087
Total non-strategic and liquidating loan portfolios $ 51,955 60,788 190,791
(1) Net of purchase accounting adjustments related to PCI loans.
(2) Includes PCI loans of $19.0 billion, $21.5 billion and $37.6 billion at December 31, 2015, 2014 and 2008, respectively.
(3) When we refer to “legacy Wells Fargo”, we mean Wells Fargo excluding Wachovia Corporation (Wachovia).
PURCHASED CREDIT-IMPAIRED (PCI) LOANS Loans
acquired with evidence of credit deterioration since their
origination and where it is probable that we will not collect all
contractually required principal and interest payments are PCI
loans. Substantially all of our PCI loans were acquired in the
Wachovia acquisition on December 31, 2008. PCI loans are
recorded at fair value at the date of acquisition, and the
historical allowance for credit losses related to these loans is not
carried over. The carrying value of PCI loans totaled
$20.0 billion at December 31, 2015, down from $23.3 billion and
$58.8 billion at December 31, 2014 and 2008, respectively. Such
loans are considered to be accruing due to the existence of the
accretable yield and not based on consideration given to
contractual interest payments. The accretable yield at
December 31, 2015, was $16.3 billion.
A nonaccretable difference is established for PCI loans to
absorb losses expected on the contractual amounts of those
loans in excess of the fair value recorded at the date of
acquisition. Amounts absorbed by the nonaccretable difference
do not affect the income statement or the allowance for credit
losses. Since December 31, 2008, we have released $11.7 billion
in nonaccretable difference, including $9.7 billion ($1.2 billion
in 2015) transferred from the nonaccretable difference to the
accretable yield and $2.0 billion released to income through
loan resolutions. Also, we have provided $1.7 billion for losses
on certain PCI loans or pools of PCI loans that have had credit-
related decreases to cash flows expected to be collected. The net
result is a $10.0 billion reduction from December 31, 2008,
through December 31, 2015, in our initial projected losses of
$41.0 billion on all PCI loans. At December 31, 2015, $1.9 billion
of nonaccretable difference remained to absorb losses on PCI
loans.
For additional information on PCI loans, see Note 1
(Summary of Significant Accounting Policies – Loans) and
Note 6 (Loans and Allowance for Credit Losses) to Financial
Statements in this Report.
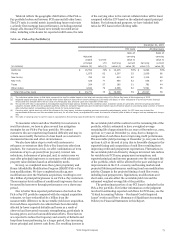
Significant Loan Portfolio Reviews Measuring and
monitoring our credit risk is an ongoing process that tracks
delinquencies, collateral values, FICO scores, economic trends
by geographic areas, loan-level risk grading for certain portfolios
(typically commercial) and other indications of credit risk. Our
credit risk monitoring process is designed to enable early
identification of developing risk and to support our
determination of an appropriate allowance for credit losses. The
following discussion provides additional characteristics and
analysis of our significant portfolios. See Note 6 (Loans and
Allowance for Credit Losses) to Financial Statements in this
Report for more analysis and credit metric information for each
of the following portfolios.
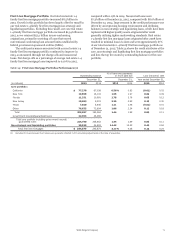
COMMERCIAL AND INDUSTRIAL LOANS AND LEASE
FINANCING For purposes of portfolio risk management, we
aggregate commercial and industrial loans and lease financing
according to market segmentation and standard industry
codes. We generally subject commercial and industrial loans and
lease financing to individual risk assessment using our internal
borrower and collateral quality ratings. Our ratings are aligned
to regulatory definitions of pass and criticized categories with
criticized divided between special mention, substandard,
doubtful and loss categories.
The commercial and industrial loans and lease financing
portfolio totaled $312.3 billion, or 34% of total loans, at
December 31, 2015. The net charge-off rate for this portfolio was
0.16% in 2015 compared with 0.10% in 2014. At December 31,
2015, 0.44% of this portfolio was nonaccruing, compared with
0.20% at December 31, 2014. In addition, $19.1 billion of this
portfolio was rated as criticized in accordance with regulatory
guidance at December 31, 2015, compared with $16.7 billion at
December 31, 2014. The increase in nonaccrual and criticized
loans in this portfolio was predominantly in the oil and gas
portfolio.
A majority of our commercial and industrial loans and lease
financing portfolio is secured by short-term assets, such as
accounts receivable, inventory and securities, as well as long-
lived assets, such as equipment and other business assets.
Generally, the collateral securing this portfolio represents a
secondary source of repayment.
Wells Fargo & Company
64