Wells Fargo 2015 Annual Report Download - page 206
Download and view the complete annual report
Please find page 206 of the 2015 Wells Fargo annual report below. You can navigate through the pages in the report by either clicking on the pages listed below, or by using the keyword search tool below to find specific information within the annual report.-
 1
1 -
2
-
3
-
4
-
5
-
6
-
7
-
8
-
9
-
10
-
11
-
12
-
13
-
14
-
15
-
16
-
17
-
18
-
19
-
20
-
21
-
22
-
23
-
24
-
25
-
26
-
27
-
28
-
29
-
30
-
31
-
32
-
33
-
34
-
35
-
36
-
37
-
38
-
39
-
40
-
41
-
42
-
43
-
44
-
45
-
46
-
47
-
48
-
49
-
50
-
51
-
52
-
53
-
54
-
55
-
56
-
57
-
58
-
59
-
60
-
61
-
62
-
63
-
64
-
65
-
66
-
67
-
68
-
69
-
70
-
71
-
72
-
73
-
74
-
75
-
76
-
77
-
78
-
79
-
80
-
81
-
82
-
83
-
84
-
85
-
86
-
87
-
88
-
89
-
90
-
91
-
92
-
93
-
94
-
95
-
96
-
97
-
98
-
99
-
100
-
101
-
102
-
103
-
104
-
105
-
106
-
107
-
108
-
109
-
110
-
111
-
112
-
113
-
114
-
115
-
116
-
117
-
118
-
119
-
120
-
121
-
122
-
123
-
124
-
125
-
126
-
127
-
128
-
129
-
130
-
131
-
132
-
133
-
134
-
135
-
136
-
137
-
138
-
139
-
140
-
141
-
142
-
143
-
144
-
145
-
146
-
147
-
148
-
149
-
150
-
151
-
152
-
153
-
154
-
155
-
156
-
157
-
158
-
159
-
160
-
161
-
162
-
163
-
164
-
165
-
166
-
167
-
168
-
169
-
170
-
171
-
172
-
173
-
174
-
175
-
176
-
177
-
178
-
179
-
180
-
181
-
182
-
183
-
184
-
185
-
186
-
187
-
188
-
189
-
190
-
191
-
192
-
193
-
194
-
195
-
 196
196 -
 197
197 -
 198
198 -
 199
199 -
 200
200 -
 201
201 -
 202
202 -
 203
203 -
 204
204 -
 205
205 -
 206
206 -
 207
207 -
 208
208 -
 209
209 -
 210
210 -
 211
211 -
 212
212 -
 213
213 -
 214
214 -
 215
215 -
 216
216 -
217
-
218
-
219
-
220
-
221
-
222
-
223
-
224
-
225
-
226
-
227
-
228
-
229
-
230
-
231
-
232
-
233
-
234
-
235
-
236
-
237
-
238
-
239
-
240
-
241
-
242
-
243
-
244
-
245
-
246
-
247
-
248
-
249
-
250
-
251
-
252
-
253
-
254
-
255
-
256
-
257
-
258
-
259
-
260
-
261
-
262
-
263
-
264
-
265
-
266
-
267
-
268
-
269
-
270
-
271
-
272
-
273
 |
 |

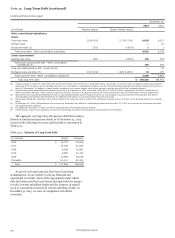
Note 14: Guarantees, Pledged Assets and Collateral (continued)
Securities Financing Activities
We enter into resale and repurchase agreements and securities
borrowing and lending agreements (collectively, “securities
financing activities”) primarily to finance inventory positions,
acquire securities to cover short trading positions, accommodate
customers’ financing needs, and settle other securities
obligations. These activities are conducted through our broker
dealer subsidiaries and to a lesser extent through other bank
entities. The majority of our securities financing activities
involve high quality, liquid securities, such as U.S. Treasury
securities and government agency securities, and to a lesser
extent, less liquid securities, including equity securities,
corporate bonds and asset-backed securities. We account for
these transactions as collateralized financings in which we
typically receive or pledge securities as collateral. We believe
these financing transactions generally do not have material
credit risk given the collateral provided and the related
monitoring processes.
OFFSETTING OF RESALE AND REPURCHASE AGREEMENTS
AND SECURITIES BORROWING AND LENDING
AGREEMENTS Table 14.3 presents resale and repurchase
agreements subject to master repurchase agreements (MRA) and
securities borrowing and lending agreements subject to master
securities lending agreements (MSLA). We account for
transactions subject to these agreements as collateralized
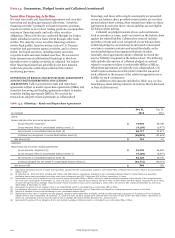
Table 14.3: Offsetting – Resale and Repurchase Agreements
financings, and those with a single counterparty are presented
net on our balance sheet, provided certain criteria are met that
permit balance sheet netting. Most transactions subject to these
agreements do not meet those criteria and thus are not eligible
for balance sheet netting.
Collateral we pledged consists of non-cash instruments,
such as securities or loans, and is not netted on the balance sheet
against the related liability. Collateral we received includes
securities or loans and is not recognized on our balance sheet.
Collateral pledged or received may be increased or decreased
over time to maintain certain contractual thresholds, as the
assets underlying each arrangement fluctuate in value.
Generally, these agreements require collateral to exceed the
asset or liability recognized on the balance sheet. The following
table includes the amount of collateral pledged or received
related to exposures subject to enforceable MRAs or MSLAs.
While these agreements are typically over-collateralized, U.S.
GAAP requires disclosure in this table to limit the amount of
such collateral to the amount of the related recognized asset or
liability for each counterparty.
In addition to the amounts included in Table 14.3, we also
have balance sheet netting related to derivatives that is disclosed
in Note 16 (Derivatives).
Dec 31, Dec 31,
(in millions) 2015 2014
Assets:
Resale and securities borrowing agreements
Gross amounts recognized $ 74,935 58,148
Gross amounts offset in consolidated balance sheet (1) (9,158) (6,477)
Net amounts in consolidated balance sheet (2) 65,777 51,671
Collateral not recognized in consolidated balance sheet (3) (65,035) (51,624)
Net amount (4) $ 742 47
Liabilities:
Repurchase and securities lending agreements
Gross amounts recognized (5) $ 91,278 56,583
Gross amounts offset in consolidated balance sheet (1) (9,158) (6,477)
Net amounts in consolidated balance sheet (6) 82,120 50,106
Collateral pledged but not netted in consolidated balance sheet (7) (81,772) (49,713)
Net amount (8) $ 348 393
(1) Represents recognized amount of resale and repurchase agreements with counterparties subject to enforceable MRAs or MSLAs that have been offset in the consolidated
balance sheet.
(2) At December 31, 2015 and 2014, includes $45.7 billion and $36.8 billion, respectively, classified on our consolidated balance sheet in federal funds sold, securities
purchased under resale agreements and other short-term investments and $20.1 billion and $14.9 billion, respectively, in loans.
(3) Represents the fair value of collateral we have received under enforceable MRAs or MSLAs, limited for table presentation purposes to the amount of the recognized asset
due from each counterparty. At December 31, 2015 and 2014, we have received total collateral with a fair value of $84.9 billion and $64.5 billion, respectively, all of which,
we have the right to sell or repledge. These amounts include securities we have sold or repledged to others with a fair value of $51.1 billion at December 31, 2015 and
$40.8 billion at December 31, 2014.
(4) Represents the amount of our exposure that is not collateralized and/or is not subject to an enforceable MRA or MSLA.
(5) For additional information on underlying collateral and contractual maturities, see the "Repurchase and Securities Lending Agreements" section in this Note.
(6) Amount is classified in short-term borrowings on our consolidated balance sheet.
(7) Represents the fair value of collateral we have pledged, related to enforceable MRAs or MSLAs, limited for table presentation purposes to the amount of the recognized
liability owed to each counterparty. At December 31, 2015 and 2014, we have pledged total collateral with a fair value of $92.9 billion and $56.5 billion, respectively, of
which, the counterparty does not have the right to sell or repledge $6.9 billion at both December 31, 2015 and 2014.
(8) Represents the amount of our obligation that is not covered by pledged collateral and/or is not subject to an enforceable MRA or MSLA.
Wells Fargo & Company
204