Wells Fargo 2015 Annual Report Download - page 207
Download and view the complete annual report
Please find page 207 of the 2015 Wells Fargo annual report below. You can navigate through the pages in the report by either clicking on the pages listed below, or by using the keyword search tool below to find specific information within the annual report.-
 1
1 -
2
-
3
-
4
-
5
-
6
-
7
-
8
-
9
-
10
-
11
-
12
-
13
-
14
-
15
-
16
-
17
-
18
-
19
-
20
-
21
-
22
-
23
-
24
-
25
-
26
-
27
-
28
-
29
-
30
-
31
-
32
-
33
-
34
-
35
-
36
-
37
-
38
-
39
-
40
-
41
-
42
-
43
-
44
-
45
-
46
-
47
-
48
-
49
-
50
-
51
-
52
-
53
-
54
-
55
-
56
-
57
-
58
-
59
-
60
-
61
-
62
-
63
-
64
-
65
-
66
-
67
-
68
-
69
-
70
-
71
-
72
-
73
-
74
-
75
-
76
-
77
-
78
-
79
-
80
-
81
-
82
-
83
-
84
-
85
-
86
-
87
-
88
-
89
-
90
-
91
-
92
-
93
-
94
-
95
-
96
-
97
-
98
-
99
-
100
-
101
-
102
-
103
-
104
-
105
-
106
-
107
-
108
-
109
-
110
-
111
-
112
-
113
-
114
-
115
-
116
-
117
-
118
-
119
-
120
-
121
-
122
-
123
-
124
-
125
-
126
-
127
-
128
-
129
-
130
-
131
-
132
-
133
-
134
-
135
-
136
-
137
-
138
-
139
-
140
-
141
-
142
-
143
-
144
-
145
-
146
-
147
-
148
-
149
-
150
-
151
-
152
-
153
-
154
-
155
-
156
-
157
-
158
-
159
-
160
-
161
-
162
-
163
-
164
-
165
-
166
-
167
-
168
-
169
-
170
-
171
-
172
-
173
-
174
-
175
-
176
-
177
-
178
-
179
-
180
-
181
-
182
-
183
-
184
-
185
-
186
-
187
-
188
-
189
-
190
-
191
-
192
-
193
-
194
-
195
-
196
-
 197
197 -
 198
198 -
 199
199 -
 200
200 -
 201
201 -
 202
202 -
 203
203 -
 204
204 -
 205
205 -
 206
206 -
 207
207 -
 208
208 -
 209
209 -
 210
210 -
 211
211 -
 212
212 -
 213
213 -
 214
214 -
 215
215 -
 216
216 -
 217
217 -
218
-
219
-
220
-
221
-
222
-
223
-
224
-
225
-
226
-
227
-
228
-
229
-
230
-
231
-
232
-
233
-
234
-
235
-
236
-
237
-
238
-
239
-
240
-
241
-
242
-
243
-
244
-
245
-
246
-
247
-
248
-
249
-
250
-
251
-
252
-
253
-
254
-
255
-
256
-
257
-
258
-
259
-
260
-
261
-
262
-
263
-
264
-
265
-
266
-
267
-
268
-
269
-
270
-
271
-
272
-
273
 |
 |

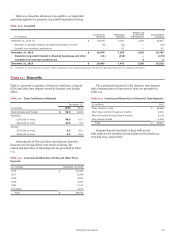
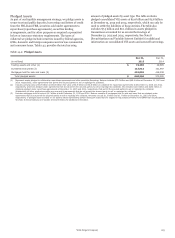
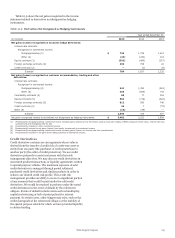
REPURCHASE AND SECURITIES LENDING AGREEMENTS
Securities sold under repurchase agreements and securities
lending arrangements are effectively short-term collateralized
borrowings. In these transactions, we receive cash in exchange
for transferring securities as collateral and recognize an
obligation to reacquire the securities for cash at the transaction's
maturity. These types of transactions create risks, including (1)
the counterparty may fail to return the securities at maturity, (2)
the fair value of the securities transferred may decline below the
amount of our obligation to reacquire the securities, and
therefore create an obligation for us to pledge additional
amounts, and (3) the counterparty may accelerate the maturity
on demand, requiring us to reacquire the security prior to
contractual maturity. We attempt to mitigate these risks by the
fact that the majority of our securities financing activities involve
highly liquid securities, we underwrite and monitor the financial
strength of our counterparties, we monitor the fair value of
collateral pledged relative to contractually required repurchase
amounts, and we monitor that our collateral is properly returned
through the clearing and settlement process in advance of our
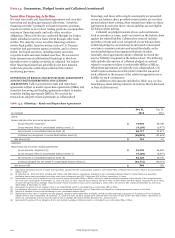
cash repayment. Table 14.4 provides the underlying collateral
types of our gross obligations under repurchase and securities
lending agreements.
Table 14.4: Underlying Collateral Types of Gross Obligations
December 31, 2015
(in millions) Total Gross Obligation
Repurchase agreements:
Securities of U.S. Treasury and federal agencies $ 32,254
Securities of U.S. States and political subdivisions 7
Federal agency mortgage-backed securities 37,033
Non-agency mortgage-backed securities 1,680
Corporate debt securities 4,674
Asset-backed securities 2,275
Equity securities 2,457
Other 1,162
Total repurchases 81,542
Securities lending:
Securities of U.S. Treasury and federal agencies 61
Federal agency mortgage-backed securities 76
Corporate debt securities 899
Equity securities (1) 8,700
Total securities lending 9,736
Total repurchases and securities lending $ 91,278
(1) Equity securities are generally exchange traded and either re-hypothecated under margin lending agreements or obtained through contemporaneous securities borrowing
transactions with other counterparties.
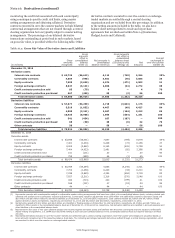
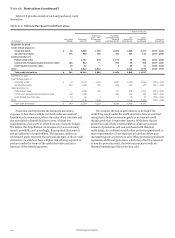
Table 14.5 provides the contractual maturities of our gross
obligations under repurchase and securities lending agreements.
Table 14.5: Contractual Maturities of Gross Obligations
December 31, 2015
Overnight/ Total Gross
(in millions) Continuous Up to 30 days 30-90 days >90 days Obligation
Repurchase agreements $ 58,021 19,561 2,935 1,025 81,542
Securities lending 7,845 362 1,529 — 9,736
Total repurchases and securities lending (1) $ 65,866 19,923 4,464 1,025 91,278
(1) Repurchase and securities lending transactions are largely conducted under enforceable master lending agreements that allow either party to terminate the transaction on
demand. These transactions have been reported as continuous obligations unless the MRA or MSLA has been modified with an overriding agreement that specifies an
alternative termination date.
Wells Fargo & Company
205