Wells Fargo 2015 Annual Report Download - page 243
Download and view the complete annual report
Please find page 243 of the 2015 Wells Fargo annual report below. You can navigate through the pages in the report by either clicking on the pages listed below, or by using the keyword search tool below to find specific information within the annual report.-
 1
1 -
2
-
3
-
4
-
5
-
6
-
7
-
8
-
9
-
10
-
11
-
12
-
13
-
14
-
15
-
16
-
17
-
18
-
19
-
20
-
21
-
22
-
23
-
24
-
25
-
26
-
27
-
28
-
29
-
30
-
31
-
32
-
33
-
34
-
35
-
36
-
37
-
38
-
39
-
40
-
41
-
42
-
43
-
44
-
45
-
46
-
47
-
48
-
49
-
50
-
51
-
52
-
53
-
54
-
55
-
56
-
57
-
58
-
59
-
60
-
61
-
62
-
63
-
64
-
65
-
66
-
67
-
68
-
69
-
70
-
71
-
72
-
73
-
74
-
75
-
76
-
77
-
78
-
79
-
80
-
81
-
82
-
83
-
84
-
85
-
86
-
87
-
88
-
89
-
90
-
91
-
92
-
93
-
94
-
95
-
96
-
97
-
98
-
99
-
100
-
101
-
102
-
103
-
104
-
105
-
106
-
107
-
108
-
109
-
110
-
111
-
112
-
113
-
114
-
115
-
116
-
117
-
118
-
119
-
120
-
121
-
122
-
123
-
124
-
125
-
126
-
127
-
128
-
129
-
130
-
131
-
132
-
133
-
134
-
135
-
136
-
137
-
138
-
139
-
140
-
141
-
142
-
143
-
144
-
145
-
146
-
147
-
148
-
149
-
150
-
151
-
152
-
153
-
154
-
155
-
156
-
157
-
158
-
159
-
160
-
161
-
162
-
163
-
164
-
165
-
166
-
167
-
168
-
169
-
170
-
171
-
172
-
173
-
174
-
175
-
176
-
177
-
178
-
179
-
180
-
181
-
182
-
183
-
184
-
185
-
186
-
187
-
188
-
189
-
190
-
191
-
192
-
193
-
194
-
195
-
196
-
197
-
198
-
199
-
200
-
201
-
202
-
203
-
204
-
205
-
206
-
207
-
208
-
209
-
210
-
211
-
212
-
213
-
214
-
215
-
216
-
217
-
218
-
219
-
220
-
221
-
222
-
223
-
224
-
225
-
226
-
227
-
228
-
229
-
230
-
231
-
232
-
 233
233 -
 234
234 -
 235
235 -
 236
236 -
 237
237 -
 238
238 -
 239
239 -
 240
240 -
 241
241 -
 242
242 -
 243
243 -
 244
244 -
 245
245 -
 246
246 -
 247
247 -
 248
248 -
 249
249 -
 250
250 -
 251
251 -
 252
252 -
 253
253 -
254
-
255
-
256
-
257
-
258
-
259
-
260
-
261
-
262
-
263
-
264
-
265
-
266
-
267
-
268
-
269
-
270
-
271
-
272
-
273
 |
 |

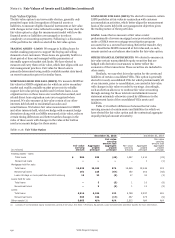
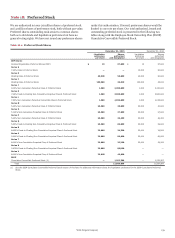
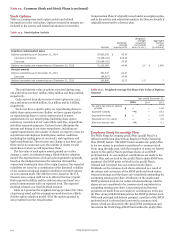
ESOP CUMULATIVE CONVERTIBLE PREFERRED STOCK All
shares of our ESOP Cumulative Convertible Preferred Stock
(ESOP Preferred Stock) were issued to a trustee acting on behalf
of the Wells Fargo & Company 401(k) Plan (the 401(k) Plan).
Dividends on the ESOP Preferred Stock are cumulative from the
date of initial issuance and are payable quarterly at annual rates
based upon the year of issuance. Each share of ESOP Preferred
Stock released from the unallocated reserve of the 401(k) Plan is
converted into shares of our common stock based on the stated
value of the ESOP Preferred Stock and the then current market
Table 18.3: ESOP Preferred Stock
price of our common stock. The ESOP Preferred Stock is also
convertible at the option of the holder at any time, unless
previously redeemed. We have the option to redeem the ESOP
Preferred Stock at any time, in whole or in part, at a redemption
price per share equal to the higher of (a) $1,000 per share plus
accrued and unpaid dividends or (b) the fair market value, as
defined in the Certificates of Designation for the ESOP Preferred
Stock.
Shares issued and outstanding Carrying value
Dec 31, Dec 31, Dec 31, Dec 31, Adjustable dividend rate
(in millions, except shares) 2015 2014 2015 2014 Minimum Maximum
ESOP Preferred Stock
$1,000 liquidation preference per share
2015 220,408 — $ 220 — 8.90% 9.90
2014 283,791 352,158 284 352 8.70 9.70
2013 251,304 288,000 251 288 8.50 9.50
2012 166,353 189,204 166 189 10.00 11.00
2011 177,614 205,263 178 205 9.00 10.00
2010 113,234 141,011 113 141 9.50 10.50
2008 28,972 42,204 29 42 10.50 11.50
2007 10,710 24,728 11 25 10.75 11.75
2006 — 8,719 — 9 10.75 11.75
Total ESOP Preferred Stock (1) 1,252,386 1,251,287 $ 1,252 1,251
Unearned ESOP shares (2) $ (1,362) (1,360)
(1) At December 31, 2015 and 2014, additional paid-in capital included $110 million and $109 million, respectively, related to ESOP preferred stock.
(2) We recorded a corresponding charge to unearned ESOP shares in connection with the issuance of the ESOP Preferred Stock. The unearned ESOP shares are reduced as
shares of the ESOP Preferred Stock are committed to be released.
Wells Fargo & Company
241