Wells Fargo 2015 Annual Report Download - page 93
Download and view the complete annual report
Please find page 93 of the 2015 Wells Fargo annual report below. You can navigate through the pages in the report by either clicking on the pages listed below, or by using the keyword search tool below to find specific information within the annual report.-
 1
1 -
2
-
3
-
4
-
5
-
6
-
7
-
8
-
9
-
10
-
11
-
12
-
13
-
14
-
15
-
16
-
17
-
18
-
19
-
20
-
21
-
22
-
23
-
24
-
25
-
26
-
27
-
28
-
29
-
30
-
31
-
32
-
33
-
34
-
35
-
36
-
37
-
38
-
39
-
40
-
41
-
42
-
43
-
44
-
45
-
46
-
47
-
48
-
49
-
50
-
51
-
52
-
53
-
54
-
55
-
56
-
57
-
58
-
59
-
60
-
61
-
62
-
63
-
64
-
65
-
66
-
67
-
68
-
69
-
70
-
71
-
72
-
73
-
74
-
75
-
76
-
77
-
78
-
79
-
80
-
81
-
82
-
 83
83 -
 84
84 -
 85
85 -
 86
86 -
 87
87 -
 88
88 -
 89
89 -
 90
90 -
 91
91 -
 92
92 -
 93
93 -
 94
94 -
 95
95 -
 96
96 -
 97
97 -
 98
98 -
 99
99 -
 100
100 -
 101
101 -
 102
102 -
 103
103 -
104
-
105
-
106
-
107
-
108
-
109
-
110
-
111
-
112
-
113
-
114
-
115
-
116
-
117
-
118
-
119
-
120
-
121
-
122
-
123
-
124
-
125
-
126
-
127
-
128
-
129
-
130
-
131
-
132
-
133
-
134
-
135
-
136
-
137
-
138
-
139
-
140
-
141
-
142
-
143
-
144
-
145
-
146
-
147
-
148
-
149
-
150
-
151
-
152
-
153
-
154
-
155
-
156
-
157
-
158
-
159
-
160
-
161
-
162
-
163
-
164
-
165
-
166
-
167
-
168
-
169
-
170
-
171
-
172
-
173
-
174
-
175
-
176
-
177
-
178
-
179
-
180
-
181
-
182
-
183
-
184
-
185
-
186
-
187
-
188
-
189
-
190
-
191
-
192
-
193
-
194
-
195
-
196
-
197
-
198
-
199
-
200
-
201
-
202
-
203
-
204
-
205
-
206
-
207
-
208
-
209
-
210
-
211
-
212
-
213
-
214
-
215
-
216
-
217
-
218
-
219
-
220
-
221
-
222
-
223
-
224
-
225
-
226
-
227
-
228
-
229
-
230
-
231
-
232
-
233
-
234
-
235
-
236
-
237
-
238
-
239
-
240
-
241
-
242
-
243
-
244
-
245
-
246
-
247
-
248
-
249
-
250
-
251
-
252
-
253
-
254
-
255
-
256
-
257
-
258
-
259
-
260
-
261
-
262
-
263
-
264
-
265
-
266
-
267
-
268
-
269
-
270
-
271
-
272
-
273
 |
 |

Changes subsequent to inception are based on changes in fair
value of the underlying loan resulting from the exercise of the
commitment and changes in the probability that the loan will not
fund within the terms of the commitment, referred to as a fall-
out factor. The value of the underlying loan commitment is
affected primarily by changes in interest rates and the passage of
time.
Outstanding derivative loan commitments expose us to the
risk that the price of the mortgage loans underlying the
commitments might decline due to increases in mortgage
interest rates from inception of the rate lock to the funding of the
loan. To minimize this risk, we employ mortgage forwards and
options, Eurodollar futures and options, and Treasury futures,
forwards and options contracts as economic hedges against the
potential decreases in the values of the loans. We expect that
these derivative financial instruments will experience changes in
fair value that will either fully or partially offset the changes in
fair value of the derivative loan commitments. However, changes
in investor demand, such as concerns about credit risk, can also
cause changes in the spread relationships between underlying
loan value and the derivative financial instruments that cannot
be hedged.
MARKET RISK – TRADING ACTIVITIES The Finance
Committee of our Board of Directors reviews the acceptable
market risk appetite for our trading activities. We engage in
trading activities primarily to accommodate the investment and
risk management activities of our customers (which involves
transactions that are recorded as trading assets and liabilities on
our balance sheet), to execute economic hedging to manage
certain balance sheet risks and, to a very limited degree, for
proprietary trading for our own account. These activities
primarily occur within our Wholesale Banking businesses and to
a lesser extent other divisions of the Company. All of our trading
assets and liabilities, including securities, foreign exchange
transactions, commodity transactions, and derivatives are
carried at fair value. Income earned related to these trading
activities include net interest income and changes in fair value
related to trading assets and liabilities. Net interest income
earned on trading assets and liabilities is reflected in the interest
income and interest expense components of our income
statement. Changes in fair value of trading assets and liabilities
are reflected in net gains on trading activities, a component of
noninterest income in our income statement.
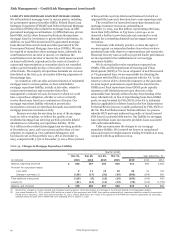
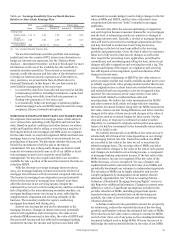
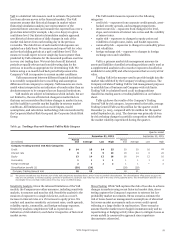
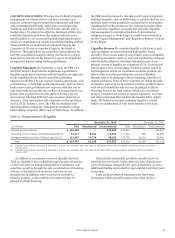
Table 41 presents total revenue from trading activities.
Table 41: Net gains (losses) from Trading Activities
Year ended December 31,
(in millions) 2015 2014 2013
Interest income (1) 1,971 1,685 1,376
Less: Interest expense (2) 357 382 307
Net interest income 1,614 1,303 1,069
Noninterest income:
Net gains (losses) from
trading activities (3):
Customer
accommodation 806 924 1,278
Economic hedges
and other (4) (192) 233 332
Proprietary trading — 4 13
Total net gains
from trading
activities 614 1,161 1,623
Total trading-related net
interest and noninterest
income 2,228 2,464 2,692
(1) Represents interest and dividend income earned on trading securities.
(2) Represents interest and dividend expense incurred on trading securities we
have sold but have not yet purchased.
(3) Represents realized gains (losses) from our trading activity and unrealized
gains (losses) due to changes in fair value of our trading positions, attributable
to the type of business activity.
(4) Excludes economic hedging of mortgage banking and asset/liability
management activities, for which hedge results (realized and unrealized) are
reported with the respective hedged activities.
Customer accommodation Customer accommodation activities
are conducted to help customers manage their investment and
risk management needs. We engage in market-making activities
or act as an intermediary to purchase or sell financial
instruments in anticipation of or in response to customer needs.
This category also includes positions we use to manage our
exposure to customer transactions.
For the majority of our customer accommodation trading,
we serve as intermediary between buyer and seller. For example,
we may purchase or sell a derivative to a customer who wants to
manage interest rate risk exposure. We typically enter into
offsetting derivative or security positions with a separate
counterparty or exchange to manage our exposure to the
derivative with our customer. We earn income on this activity
based on the transaction price difference between the customer
and offsetting derivative or security positions, which is reflected
in the fair value changes of the positions recorded in net gains on
trading activities.
Customer accommodation trading also includes net gains
related to market-making activities in which we take positions to
facilitate customer order flow. For example, we may own
securities recorded as trading assets (long positions) or sold
securities we have not yet purchased, recorded as trading
liabilities (short positions), typically on a short-term basis, to
facilitate support of buying and selling demand from our
customers. As a market maker in these securities, we earn
income due to: (1) the difference between the price paid or
received for the purchase and sale of the security (bid-ask
spread), (2) the net interest income, and (3) the change in fair
value of the long or short positions during the short-term period
held on our balance sheet. Additionally, we may enter into
separate derivative or security positions to manage our exposure
related to our long or short security positions. Income earned on
this type of market-making activity is reflected in the fair value
changes of these positions recorded in net gains on trading
activities.
Wells Fargo & Company
91