Wells Fargo 2015 Annual Report Download - page 73
Download and view the complete annual report
Please find page 73 of the 2015 Wells Fargo annual report below. You can navigate through the pages in the report by either clicking on the pages listed below, or by using the keyword search tool below to find specific information within the annual report.-
 1
1 -
2
-
3
-
4
-
5
-
6
-
7
-
8
-
9
-
10
-
11
-
12
-
13
-
14
-
15
-
16
-
17
-
18
-
19
-
20
-
21
-
22
-
23
-
24
-
25
-
26
-
27
-
28
-
29
-
30
-
31
-
32
-
33
-
34
-
35
-
36
-
37
-
38
-
39
-
40
-
41
-
42
-
43
-
44
-
45
-
46
-
47
-
48
-
49
-
50
-
51
-
52
-
53
-
54
-
55
-
56
-
57
-
58
-
59
-
60
-
61
-
62
-
 63
63 -
 64
64 -
 65
65 -
 66
66 -
 67
67 -
 68
68 -
 69
69 -
 70
70 -
 71
71 -
 72
72 -
 73
73 -
 74
74 -
 75
75 -
 76
76 -
 77
77 -
 78
78 -
 79
79 -
 80
80 -
 81
81 -
 82
82 -
 83
83 -
84
-
85
-
86
-
87
-
88
-
89
-
90
-
91
-
92
-
93
-
94
-
95
-
96
-
97
-
98
-
99
-
100
-
101
-
102
-
103
-
104
-
105
-
106
-
107
-
108
-
109
-
110
-
111
-
112
-
113
-
114
-
115
-
116
-
117
-
118
-
119
-
120
-
121
-
122
-
123
-
124
-
125
-
126
-
127
-
128
-
129
-
130
-
131
-
132
-
133
-
134
-
135
-
136
-
137
-
138
-
139
-
140
-
141
-
142
-
143
-
144
-
145
-
146
-
147
-
148
-
149
-
150
-
151
-
152
-
153
-
154
-
155
-
156
-
157
-
158
-
159
-
160
-
161
-
162
-
163
-
164
-
165
-
166
-
167
-
168
-
169
-
170
-
171
-
172
-
173
-
174
-
175
-
176
-
177
-
178
-
179
-
180
-
181
-
182
-
183
-
184
-
185
-
186
-
187
-
188
-
189
-
190
-
191
-
192
-
193
-
194
-
195
-
196
-
197
-
198
-
199
-
200
-
201
-
202
-
203
-
204
-
205
-
206
-
207
-
208
-
209
-
210
-
211
-
212
-
213
-
214
-
215
-
216
-
217
-
218
-
219
-
220
-
221
-
222
-
223
-
224
-
225
-
226
-
227
-
228
-
229
-
230
-
231
-
232
-
233
-
234
-
235
-
236
-
237
-
238
-
239
-
240
-
241
-
242
-
243
-
244
-
245
-
246
-
247
-
248
-
249
-
250
-
251
-
252
-
253
-
254
-
255
-
256
-
257
-
258
-
259
-
260
-
261
-
262
-
263
-
264
-
265
-
266
-
267
-
268
-
269
-
270
-
271
-
272
-
273
 |
 |

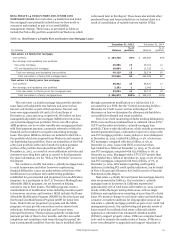
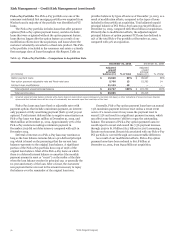
First Lien Mortgage Portfolio Our total real estate 1-4
family first lien mortgage portfolio increased $8.5 billion in
2015. Growth in this portfolio has been largely offset by runoff in
our real estate 1-4 family first lien mortgage non-strategic and
liquidating portfolios. Excluding this runoff, our core real estate
1-4 family first lien mortgage portfolio increased $15.9 billion in
2015, as we retained $53.1 billion in non-conforming
originations, primarily consisting of loans that exceed
conventional conforming loan amount limits established by
federal government-sponsored entities (GSEs).
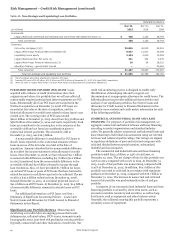
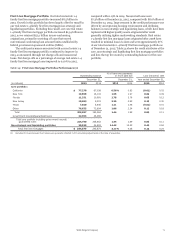
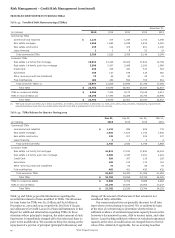
The credit performance associated with our real estate 1-4
family first lien mortgage portfolio continued to improve in
2015, as measured through net charge-offs and nonaccrual
loans. Net charge-offs as a percentage of average real estate 1-4
family first lien mortgage loans improved to 0.10% in 2015,
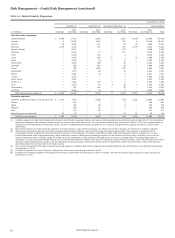
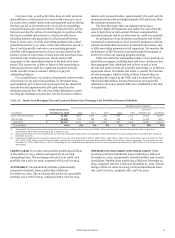
Table 24: First Lien Mortgage Portfolios Performance (1)
compared with 0.19% in 2014. Nonaccrual loans were
$7.3 billion at December 31, 2015, compared with $8.6 billion at
December 31, 2014. Improvement in the credit performance was
driven by an improving housing environment and declining
balances in non-strategic and liquidating loans, which have been
replaced with higher quality assets originated after 2008
generally utilizing tighter underwriting standards. Real estate
1-4 family first lien mortgage loans originated after 2008 have
resulted in minimal losses to date and were approximately 67%
of our total real estate 1-4 family first lien mortgage portfolio as
of December 31, 2015. Table 24 shows the credit attributes of the
core, non-strategic and liquidating first lien mortgage portfolios
and lists the top five states by outstanding balance for the core
portfolio.
Outstanding balance
% of loans two payments
or more past due Loss (recovery) rate
December 31, December 31, Year ended December 31,
(in millions) 2015 2014 2015 2014 2015 2014
Core portfolio:
California $ 77,270 67,038 0.56% 0.83 (0.01) 0.02
New York 19,858 16,102 1.55 1.97 0.04 0.09
Florida 11,331 10,991 2.78 3.78 0.05 0.12
New Jersey 10,283 9,203 3.35 3.95 0.18 0.30
Texas 7,020 6,646 1.21 1.48 (0.01) 0.01
Other 76,635 72,604 1.86 2.34 0.12 0.18
Total 202,397 182,584 1.44 1.89 0.06 0.11
Government insured/guaranteed loans 22,353 26,268
Total core portfolio including government insured/
guaranteed loans 224,750 208,852 1.44 1.89 0.06 0.11
Non-strategic and liquidating portfolios 29,929 34,822 14.42 15.55 0.46 0.84
Total first lien mortgages $ 254,679 243,674 3.11% 4.08 0.12 0.24
(1) Excludes PCI loans because their losses were generally reflected in PCI accounting adjustments at the date of acquisition.
Wells Fargo & Company
71