Wells Fargo 2015 Annual Report Download - page 174
Download and view the complete annual report
Please find page 174 of the 2015 Wells Fargo annual report below. You can navigate through the pages in the report by either clicking on the pages listed below, or by using the keyword search tool below to find specific information within the annual report.-
 1
1 -
2
-
3
-
4
-
5
-
6
-
7
-
8
-
9
-
10
-
11
-
12
-
13
-
14
-
15
-
16
-
17
-
18
-
19
-
20
-
21
-
22
-
23
-
24
-
25
-
26
-
27
-
28
-
29
-
30
-
31
-
32
-
33
-
34
-
35
-
36
-
37
-
38
-
39
-
40
-
41
-
42
-
43
-
44
-
45
-
46
-
47
-
48
-
49
-
50
-
51
-
52
-
53
-
54
-
55
-
56
-
57
-
58
-
59
-
60
-
61
-
62
-
63
-
64
-
65
-
66
-
67
-
68
-
69
-
70
-
71
-
72
-
73
-
74
-
75
-
76
-
77
-
78
-
79
-
80
-
81
-
82
-
83
-
84
-
85
-
86
-
87
-
88
-
89
-
90
-
91
-
92
-
93
-
94
-
95
-
96
-
97
-
98
-
99
-
100
-
101
-
102
-
103
-
104
-
105
-
106
-
107
-
108
-
109
-
110
-
111
-
112
-
113
-
114
-
115
-
116
-
117
-
118
-
119
-
120
-
121
-
122
-
123
-
124
-
125
-
126
-
127
-
128
-
129
-
130
-
131
-
132
-
133
-
134
-
135
-
136
-
137
-
138
-
139
-
140
-
141
-
142
-
143
-
144
-
145
-
146
-
147
-
148
-
149
-
150
-
151
-
152
-
153
-
154
-
155
-
156
-
157
-
158
-
159
-
160
-
161
-
162
-
163
-
 164
164 -
 165
165 -
 166
166 -
 167
167 -
 168
168 -
 169
169 -
 170
170 -
 171
171 -
 172
172 -
 173
173 -
 174
174 -
 175
175 -
 176
176 -
 177
177 -
 178
178 -
 179
179 -
 180
180 -
 181
181 -
 182
182 -
 183
183 -
 184
184 -
185
-
186
-
187
-
188
-
189
-
190
-
191
-
192
-
193
-
194
-
195
-
196
-
197
-
198
-
199
-
200
-
201
-
202
-
203
-
204
-
205
-
206
-
207
-
208
-
209
-
210
-
211
-
212
-
213
-
214
-
215
-
216
-
217
-
218
-
219
-
220
-
221
-
222
-
223
-
224
-
225
-
226
-
227
-
228
-
229
-
230
-
231
-
232
-
233
-
234
-
235
-
236
-
237
-
238
-
239
-
240
-
241
-
242
-
243
-
244
-
245
-
246
-
247
-
248
-
249
-
250
-
251
-
252
-
253
-
254
-
255
-
256
-
257
-
258
-
259
-
260
-
261
-
262
-
263
-
264
-
265
-
266
-
267
-
268
-
269
-
270
-
271
-
272
-
273
 |
 |

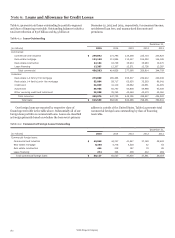
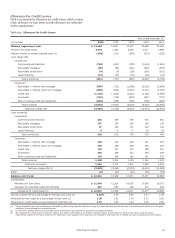
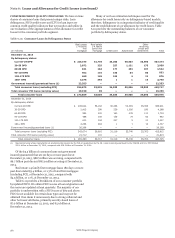
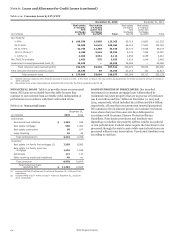
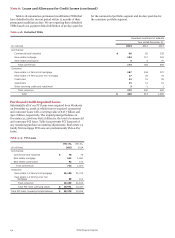
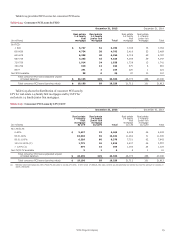
Note 6: Loans and Allowance for Credit Losses (continued)
IMPAIRED LOANS Table 6.15 summarizes key information for
impaired loans. Our impaired loans predominantly include loans
on nonaccrual status in the commercial portfolio segment and
loans modified in a TDR, whether on accrual or nonaccrual
status. These impaired loans generally have estimated losses
which are included in the allowance for credit losses. We have
impaired loans with no allowance for credit losses when loss
content has been previously recognized through charge-offs and
we do not anticipate additional charge-offs or losses, or certain
Table 6.15: Impaired Loans Summary
loans are currently performing in accordance with their terms
and for which no loss has been estimated. Impaired loans
exclude PCI loans. Table 6.15 includes trial modifications that
totaled $402 million at December 31, 2015, and $452 million at
December 31, 2014.
For additional information on our impaired loans and
allowance for credit losses, see Note 1 (Summary of Significant
Accounting Policies).
Recorded investment
Impaired
loans with
Unpaid related Related
principal Impaired allowance for allowance for
(in millions) balance (1) loans credit losses credit losses
December 31, 2015
Commercial:
Commercial and industrial $ 2,746 1,835 1,648 435
Real estate mortgage 2,369 1,815 1,773 405
Real estate construction 262 131 112 23
Lease financing 38 27 27 9
Total commercial 5,415 3,808 3,560 872
Consumer:
Real estate 1-4 family first mortgage 19,626 17,121 11,057 1,643
Real estate 1-4 family junior lien mortgage 2,704 2,408 1,859 447
Credit card 299 299 299 94
Automobile 173 105 41 5
Other revolving credit and installment 86 79 71 15
Total consumer (2) 22,888 20,012 13,327 2,204
Total impaired loans (excluding PCI) $ 28,303 23,820 16,887 3,076
December 31, 2014
Commercial:
Commercial and industrial $ 1,524 926 757 240
Real estate mortgage 3,190 2,483 2,405 591
Real estate construction 491 331 308 45
Lease financing 33 19 19 8
Total commercial 5,238 3,759 3,489 884
Consumer:
Real estate 1-4 family first mortgage 21,324 18,600 12,433 2,322
Real estate 1-4 family junior lien mortgage 3,094 2,534 2,009 653
Credit card 338 338 338 98
Automobile 190 127 55 8
Other revolving credit and installment 60 50 42 5
Total consumer (2) 25,006 21,649 14,877 3,086
Total impaired loans (excluding PCI) $ 30,244 25,408 18,366 3,970
(1) Excludes the unpaid principal balance for loans that have been fully charged off or otherwise have zero recorded investment.
(2) Years ended December 31, 2015 and 2014, include the recorded investment of $1.8 billion and $2.1 billion, respectively, of government insured/guaranteed loans that are
predominantly insured by the FHA or guaranteed by the VA and generally do not have an allowance. Impaired loans may also have limited, if any, allowance when the
recorded investment of the loan approximates estimated net realizable value as a result of charge-offs prior to a TDR modification.
Wells Fargo & Company
172