Wells Fargo 2015 Annual Report Download - page 221
Download and view the complete annual report
Please find page 221 of the 2015 Wells Fargo annual report below. You can navigate through the pages in the report by either clicking on the pages listed below, or by using the keyword search tool below to find specific information within the annual report.-
 1
1 -
2
-
3
-
4
-
5
-
6
-
7
-
8
-
9
-
10
-
11
-
12
-
13
-
14
-
15
-
16
-
17
-
18
-
19
-
20
-
21
-
22
-
23
-
24
-
25
-
26
-
27
-
28
-
29
-
30
-
31
-
32
-
33
-
34
-
35
-
36
-
37
-
38
-
39
-
40
-
41
-
42
-
43
-
44
-
45
-
46
-
47
-
48
-
49
-
50
-
51
-
52
-
53
-
54
-
55
-
56
-
57
-
58
-
59
-
60
-
61
-
62
-
63
-
64
-
65
-
66
-
67
-
68
-
69
-
70
-
71
-
72
-
73
-
74
-
75
-
76
-
77
-
78
-
79
-
80
-
81
-
82
-
83
-
84
-
85
-
86
-
87
-
88
-
89
-
90
-
91
-
92
-
93
-
94
-
95
-
96
-
97
-
98
-
99
-
100
-
101
-
102
-
103
-
104
-
105
-
106
-
107
-
108
-
109
-
110
-
111
-
112
-
113
-
114
-
115
-
116
-
117
-
118
-
119
-
120
-
121
-
122
-
123
-
124
-
125
-
126
-
127
-
128
-
129
-
130
-
131
-
132
-
133
-
134
-
135
-
136
-
137
-
138
-
139
-
140
-
141
-
142
-
143
-
144
-
145
-
146
-
147
-
148
-
149
-
150
-
151
-
152
-
153
-
154
-
155
-
156
-
157
-
158
-
159
-
160
-
161
-
162
-
163
-
164
-
165
-
166
-
167
-
168
-
169
-
170
-
171
-
172
-
173
-
174
-
175
-
176
-
177
-
178
-
179
-
180
-
181
-
182
-
183
-
184
-
185
-
186
-
187
-
188
-
189
-
190
-
191
-
192
-
193
-
194
-
195
-
196
-
197
-
198
-
199
-
200
-
201
-
202
-
203
-
204
-
205
-
206
-
207
-
208
-
209
-
210
-
 211
211 -
 212
212 -
 213
213 -
 214
214 -
 215
215 -
 216
216 -
 217
217 -
 218
218 -
 219
219 -
 220
220 -
 221
221 -
 222
222 -
 223
223 -
 224
224 -
 225
225 -
 226
226 -
 227
227 -
 228
228 -
 229
229 -
 230
230 -
 231
231 -
232
-
233
-
234
-
235
-
236
-
237
-
238
-
239
-
240
-
241
-
242
-
243
-
244
-
245
-
246
-
247
-
248
-
249
-
250
-
251
-
252
-
253
-
254
-
255
-
256
-
257
-
258
-
259
-
260
-
261
-
262
-
263
-
264
-
265
-
266
-
267
-
268
-
269
-
270
-
271
-
272
-
273
 |
 |

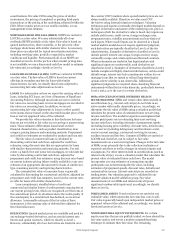
and valuation techniques used are appropriate. Once these
vendors are approved to provide pricing information, we
monitor and review the results to ensure the fair values are
reasonable and in line with market experience in similar asset
classes. While the input amounts used by the pricing vendor in
determining fair value are not provided, and therefore
unavailable for our review, we do perform one or more of the
following procedures to validate the prices received:
• comparison to other pricing vendors (if available);
• variance analysis of prices;
• corroboration of pricing by reference to other independent
market data, such as market transactions and relevant
benchmark indices;
• review of pricing by Company personnel familiar with
market liquidity and other market-related conditions; and
• investigation of prices on a specific instrument-by-
instrument basis.
Fair Value Measurements from Vendors
For certain assets and liabilities, we obtain fair value
measurements from vendors, which predominantly consist of
third-party pricing services, and record the unadjusted fair value
in our financial statements. For instruments where we utilize
vendor prices to record the price of an instrument, we perform
additional procedures (see the "Vendor-Developed Valuation"
section). Methodologies employed, controls relied upon and
inputs used by third-party pricing vendors are subject to
additional review when such services are provided. This review
may consist of, in part, obtaining and evaluating control reports
issued and pricing methodology materials distributed.
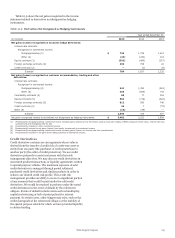
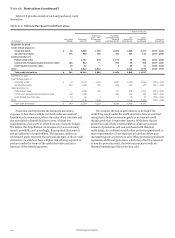
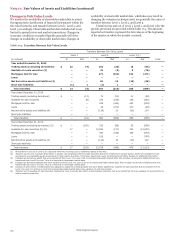
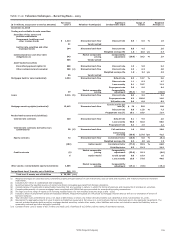
Table 17.1 presents unadjusted fair value measurements
provided by brokers or third-party pricing services fair value
hierarchy level . Fair value measurements obtained from brokers
or third-party pricing services that we have adjusted to
determine the fair value recorded in our financial statements are
excluded from Table 17.1.
Table 17.1: Fair Value Measurements by Brokers or Third-Party Pricing Services
Brokers Third-party pricing services
(in millions)
December 31, 2015
Trading assets (excluding derivatives)
Available-for-sale securities:
$
Level 1
—
Level 2
—
Level 3
—
Level 1
—
Level 2
5
Level 3
—
Securities of U.S. Treasury and federal agencies
Securities of U.S. states and political subdivisions
Mortgage-backed securities
Other debt securities (1)
Total debt securities
Total marketable equity securities
Total available-for-sale securities
—
—
—
—
—
—
—
—
—
226
503
729
—
729
—
—
—
409
409
—
409
32,868
—
—
—
32,868
—
32,868
3,382
48,443
126,525
48,721
227,071
484
227,555
—
51
73
345
469
—
469
Derivatives (trading and other assets) — — — — 224 —
Derivatives (liabilities) — — — — (221) —
Other liabilities — — — — (1) —
December 31, 2014
Trading assets (excluding derivatives) $ — — — 2 105 —
Available-for-sale securities:
Securities of U.S. Treasury and federal agencies — — — 19,899 5,905 —
Securities of U.S. states and political subdivisions — — — — 42,666 61
Mortgage-backed securities — 152 — — 135,997 133
Other debt securities (1) — 1,035 601 — 41,933 541
Total debt securities — 1,187 601 19,899 226,501
Total marketable equity securities — — — — 569 —
Total available-for-sale securities — 1,187 601 19,899 227,070
Derivatives (trading and other assets) — 1 — — 290 —
Derivatives (liabilities) — (1) — — (292) —
Other liabilities — — — — (1) —
(1) Includes corporate debt securities, collateralized loan and other debt obligations, asset-backed securities, and other debt securities.
Wells Fargo & Company
735
735
219