Wells Fargo 2015 Annual Report Download - page 240
Download and view the complete annual report
Please find page 240 of the 2015 Wells Fargo annual report below. You can navigate through the pages in the report by either clicking on the pages listed below, or by using the keyword search tool below to find specific information within the annual report.-
 1
1 -
2
-
3
-
4
-
5
-
6
-
7
-
8
-
9
-
10
-
11
-
12
-
13
-
14
-
15
-
16
-
17
-
18
-
19
-
20
-
21
-
22
-
23
-
24
-
25
-
26
-
27
-
28
-
29
-
30
-
31
-
32
-
33
-
34
-
35
-
36
-
37
-
38
-
39
-
40
-
41
-
42
-
43
-
44
-
45
-
46
-
47
-
48
-
49
-
50
-
51
-
52
-
53
-
54
-
55
-
56
-
57
-
58
-
59
-
60
-
61
-
62
-
63
-
64
-
65
-
66
-
67
-
68
-
69
-
70
-
71
-
72
-
73
-
74
-
75
-
76
-
77
-
78
-
79
-
80
-
81
-
82
-
83
-
84
-
85
-
86
-
87
-
88
-
89
-
90
-
91
-
92
-
93
-
94
-
95
-
96
-
97
-
98
-
99
-
100
-
101
-
102
-
103
-
104
-
105
-
106
-
107
-
108
-
109
-
110
-
111
-
112
-
113
-
114
-
115
-
116
-
117
-
118
-
119
-
120
-
121
-
122
-
123
-
124
-
125
-
126
-
127
-
128
-
129
-
130
-
131
-
132
-
133
-
134
-
135
-
136
-
137
-
138
-
139
-
140
-
141
-
142
-
143
-
144
-
145
-
146
-
147
-
148
-
149
-
150
-
151
-
152
-
153
-
154
-
155
-
156
-
157
-
158
-
159
-
160
-
161
-
162
-
163
-
164
-
165
-
166
-
167
-
168
-
169
-
170
-
171
-
172
-
173
-
174
-
175
-
176
-
177
-
178
-
179
-
180
-
181
-
182
-
183
-
184
-
185
-
186
-
187
-
188
-
189
-
190
-
191
-
192
-
193
-
194
-
195
-
196
-
197
-
198
-
199
-
200
-
201
-
202
-
203
-
204
-
205
-
206
-
207
-
208
-
209
-
210
-
211
-
212
-
213
-
214
-
215
-
216
-
217
-
218
-
219
-
220
-
221
-
222
-
223
-
224
-
225
-
226
-
227
-
228
-
229
-
 230
230 -
 231
231 -
 232
232 -
 233
233 -
 234
234 -
 235
235 -
 236
236 -
 237
237 -
 238
238 -
 239
239 -
 240
240 -
 241
241 -
 242
242 -
 243
243 -
 244
244 -
 245
245 -
 246
246 -
 247
247 -
 248
248 -
 249
249 -
 250
250 -
251
-
252
-
253
-
254
-
255
-
256
-
257
-
258
-
259
-
260
-
261
-
262
-
263
-
264
-
265
-
266
-
267
-
268
-
269
-
270
-
271
-
272
-
273
 |
 |

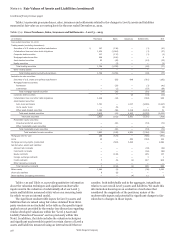
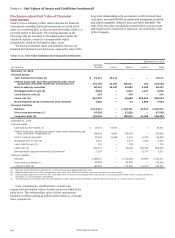
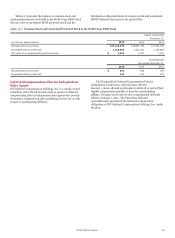
Note 17: Fair Values of Assets and Liabilities (continued)
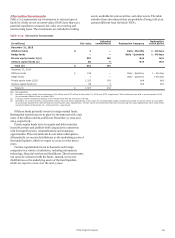
Disclosures about Fair Value of Financial
Instruments
Table 17.19 is a summary of fair value estimates for financial
instruments, excluding financial instruments recorded at fair
value on a recurring basis as they are included within Table 17.2
included earlier in this Note. The carrying amounts in the
following table are recorded on the balance sheet under the
indicated captions, except for nonmarketable equity
investments, which are included in other assets.
We have not included assets and liabilities that are not
financial instruments in our disclosure, such as the value of the
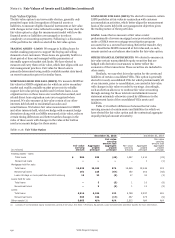
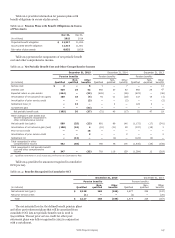
Table 17.19: Fair Value Estimates for Financial Instruments
long-term relationships with our deposit, credit card and trust
customers, amortized MSRs, premises and equipment, goodwill
and other intangibles, deferred taxes and other liabilities. The
total of the fair value calculations presented does not represent,
and should not be construed to represent, the underlying value
of the Company.
Estimated fair value
(in millions)
Carrying
amount Level 1 Level 2 Level 3 Total
December 31, 2015
Financial assets
Cash and due from banks (1) $ 19,111 19,111 — — 19,111
Federal funds sold, securities purchased under resale
agreements and other short-term investments (1) 270,130 14,057 255,911 162 270,130
Held-to-maturity securities 80,197 45,167 32,052 3,348 80,567
Mortgages held for sale (2) 6,064 — 5,019 1,047 6,066
Loans held for sale (2) 279 — 279 — 279
Loans, net (3) 887,497 — 60,848 839,816 900,664
Nonmarketable equity investments (cost method) 7,035 — 14 7,890 7,904
Financial liabilities
Deposits 1,223,312 — 1,194,781 28,616 1,223,397
Short-term borrowings (1) 97,528 — 97,528 — 97,528
Long-term debt (4) 199,528 — 188,015 10,468 198,483
December 31, 2014
Financial assets
Cash and due from banks (1) $ 19,571 19,571 — — 19,571
Federal funds sold, securities purchased under resale agreements and
other short-term investments (1) 258,429 8,991 249,438 — 258,429
Held to maturity securities 55,483 41,548 9,021 5,790 56,359
Mortgages held for sale (2) 3,971 — 2,875 1,098 3,973
Loans held for sale (2) 721 — 739 — 739
Loans, net (3) 832,671 — 60,052 784,786 844,838
Nonmarketable equity investments (cost method) 7,033 — — 8,377 8,377
Financial liabilities
Deposits 1,168,310 — 1,132,845 35,566 1,168,411
Short-term borrowings (1) 63,518 — 63,518 — 63,518
Long-term debt (4) 183,934 — 174,996 10,479 185,475
(1) Amounts consist of financial instruments in which carrying value approximates fair value.
(2) Balance reflects MHFS and LHFS, as applicable, other than those MHFS and LHFS for which we elected the fair value option.
(3) Loans exclude balances for which the fair value option was elected and also exclude lease financing with a carrying amount of $12.4 billion and $12.3 billion at
December 31, 2015 and 2014, respectively.
(4) The carrying amount and fair value exclude obligations under capital leases of $8 million and $9 million at December 31, 2015 and 2014, respectively.
Loan commitments, standby letters of credit and
commercial and similar letters of credit are not included in the
table above. The estimated fair value of these instruments
totaled $1.0 billion and $945 million at December 31, 2015 and
2014, respectively.
Wells Fargo & Company
238