Wells Fargo 2015 Annual Report Download - page 172
Download and view the complete annual report
Please find page 172 of the 2015 Wells Fargo annual report below. You can navigate through the pages in the report by either clicking on the pages listed below, or by using the keyword search tool below to find specific information within the annual report.-
 1
1 -
2
-
3
-
4
-
5
-
6
-
7
-
8
-
9
-
10
-
11
-
12
-
13
-
14
-
15
-
16
-
17
-
18
-
19
-
20
-
21
-
22
-
23
-
24
-
25
-
26
-
27
-
28
-
29
-
30
-
31
-
32
-
33
-
34
-
35
-
36
-
37
-
38
-
39
-
40
-
41
-
42
-
43
-
44
-
45
-
46
-
47
-
48
-
49
-
50
-
51
-
52
-
53
-
54
-
55
-
56
-
57
-
58
-
59
-
60
-
61
-
62
-
63
-
64
-
65
-
66
-
67
-
68
-
69
-
70
-
71
-
72
-
73
-
74
-
75
-
76
-
77
-
78
-
79
-
80
-
81
-
82
-
83
-
84
-
85
-
86
-
87
-
88
-
89
-
90
-
91
-
92
-
93
-
94
-
95
-
96
-
97
-
98
-
99
-
100
-
101
-
102
-
103
-
104
-
105
-
106
-
107
-
108
-
109
-
110
-
111
-
112
-
113
-
114
-
115
-
116
-
117
-
118
-
119
-
120
-
121
-
122
-
123
-
124
-
125
-
126
-
127
-
128
-
129
-
130
-
131
-
132
-
133
-
134
-
135
-
136
-
137
-
138
-
139
-
140
-
141
-
142
-
143
-
144
-
145
-
146
-
147
-
148
-
149
-
150
-
151
-
152
-
153
-
154
-
155
-
156
-
157
-
158
-
159
-
160
-
161
-
 162
162 -
 163
163 -
 164
164 -
 165
165 -
 166
166 -
 167
167 -
 168
168 -
 169
169 -
 170
170 -
 171
171 -
 172
172 -
 173
173 -
 174
174 -
 175
175 -
 176
176 -
 177
177 -
 178
178 -
 179
179 -
 180
180 -
 181
181 -
 182
182 -
183
-
184
-
185
-
186
-
187
-
188
-
189
-
190
-
191
-
192
-
193
-
194
-
195
-
196
-
197
-
198
-
199
-
200
-
201
-
202
-
203
-
204
-
205
-
206
-
207
-
208
-
209
-
210
-
211
-
212
-
213
-
214
-
215
-
216
-
217
-
218
-
219
-
220
-
221
-
222
-
223
-
224
-
225
-
226
-
227
-
228
-
229
-
230
-
231
-
232
-
233
-
234
-
235
-
236
-
237
-
238
-
239
-
240
-
241
-
242
-
243
-
244
-
245
-
246
-
247
-
248
-
249
-
250
-
251
-
252
-
253
-
254
-
255
-
256
-
257
-
258
-
259
-
260
-
261
-
262
-
263
-
264
-
265
-
266
-
267
-
268
-
269
-
270
-
271
-
272
-
273
 |
 |
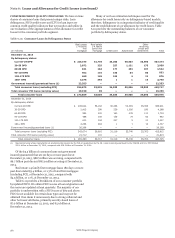
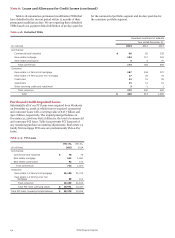
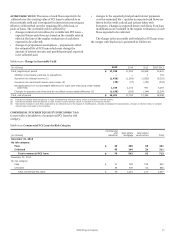
Note 6: Loans and Allowance for Credit Losses (continued)
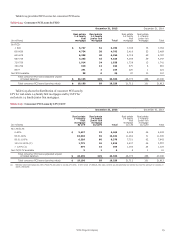
Table 6.12: Consumer Loans by LTV/CLTV
December 31, 2015 December 31, 2014
Real estate Real estate Real estate Real estate
(in millions)
1-4 family
first
mortgage
by LTV
1-4 family
junior lien
mortgage
by CLTV Total
1-4 family
first
mortgage
by LTV
1-4 family
junior lien
mortgage
by CLTV Total
By LTV/CLTV:
0-60% $ 109,558 15,805 125,363 95,719 15,603 111,322
60.01-80% 92,005 16,579 108,584 86,112 17,651 103,763
80.01-100% 22,765 11,385 34,150 25,170 14,004 39,174
100.01-120% (1) 4,480 5,545 10,025 6,133 7,254 13,387
> 120% (1) 2,065 3,051 5,116 2,856 4,058 6,914
No LTV/CLTV available 1,453 570 2,023 1,416 1,046 2,462
Government insured/guaranteed loans (2) 22,353 — 22,353 26,268 — 26,268
Total consumer loans (excluding PCI) 254,679 52,935 307,614 243,674 59,616 303,290
Total consumer PCI loans (carrying value) 19,190 69 19,259 21,712 101 21,813
Total consumer loans $ 273,869 53,004 326,873 265,386 59,717 325,103
(1) Reflects total loan balances with LTV/CLTV amounts in excess of 100%. In the event of default, the loss content would generally be limited to only the amount in excess of
100% LTV/CLTV.
(2) Represents loans whose repayments are predominantly insured by the FHA or guaranteed by the VA.
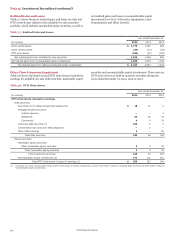
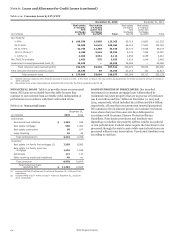
NONACCRUAL LOANS Table 6.13 provides loans on nonaccrual LOANS IN PROCESS OF FORECLOSURE Our recorded
status. PCI loans are excluded from this table because they investment in consumer mortgage loans collateralized by
continue to earn interest from accretable yield, independent of residential real estate property that are in process of foreclosure
performance in accordance with their contractual terms. was $11.0 billion and $12.7 billion at December 31, 2015 and
2014, respectively, which included $6.2 billion and $6.6 billion,
Table 6.13: Nonaccrual Loans respectively, of loans that are government insured/guaranteed.
We commence the foreclosure process on consumer real estate
December 31, loans when a borrower becomes 120 days delinquent in
(in millions) 2015 2014 accordance with Consumer Finance Protection Bureau
Commercial: Guidelines. Foreclosure procedures and timelines vary
Commercial and industrial $ 1,363 538 depending on whether the property address resides in a judicial
or non-judicial state. Judicial states require the foreclosure to be
Real estate mortgage 969 1,490 processed through the state's courts while non-judicial states are
Real estate construction 66 187 processed without court intervention. Foreclosure timelines vary
Lease financing 26 24 according to state law.
Total commercial (1) 2,424 2,239
Consumer:
Real estate 1-4 family first mortgage (2) 7,293 8,583
Real estate 1-4 family junior lien
mortgage 1,495 1,848
Automobile 121 137
Other revolving credit and installment 49 41
Total consumer 8,958 10,609
Total nonaccrual loans
(excluding PCI) $ 11,382 12,848
(1) Includes LHFS of $0 million and $1 million at December 31, 2015 and 2014,
respectively.
(2) Includes MHFS of $177 million and $177 million at December 31, 2015 and
2014, respectively.
Wells Fargo & Company
170