Wells Fargo 2015 Annual Report Download - page 54
Download and view the complete annual report
Please find page 54 of the 2015 Wells Fargo annual report below. You can navigate through the pages in the report by either clicking on the pages listed below, or by using the keyword search tool below to find specific information within the annual report.-
 1
1 -
2
-
3
-
4
-
5
-
6
-
7
-
8
-
9
-
10
-
11
-
12
-
13
-
14
-
15
-
16
-
17
-
18
-
19
-
20
-
21
-
22
-
23
-
24
-
25
-
26
-
27
-
28
-
29
-
30
-
31
-
32
-
33
-
34
-
35
-
36
-
37
-
38
-
39
-
40
-
41
-
42
-
43
-
 44
44 -
 45
45 -
 46
46 -
 47
47 -
 48
48 -
 49
49 -
 50
50 -
 51
51 -
 52
52 -
 53
53 -
 54
54 -
 55
55 -
 56
56 -
 57
57 -
 58
58 -
 59
59 -
 60
60 -
 61
61 -
 62
62 -
 63
63 -
 64
64 -
65
-
66
-
67
-
68
-
69
-
70
-
71
-
72
-
73
-
74
-
75
-
76
-
77
-
78
-
79
-
80
-
81
-
82
-
83
-
84
-
85
-
86
-
87
-
88
-
89
-
90
-
91
-
92
-
93
-
94
-
95
-
96
-
97
-
98
-
99
-
100
-
101
-
102
-
103
-
104
-
105
-
106
-
107
-
108
-
109
-
110
-
111
-
112
-
113
-
114
-
115
-
116
-
117
-
118
-
119
-
120
-
121
-
122
-
123
-
124
-
125
-
126
-
127
-
128
-
129
-
130
-
131
-
132
-
133
-
134
-
135
-
136
-
137
-
138
-
139
-
140
-
141
-
142
-
143
-
144
-
145
-
146
-
147
-
148
-
149
-
150
-
151
-
152
-
153
-
154
-
155
-
156
-
157
-
158
-
159
-
160
-
161
-
162
-
163
-
164
-
165
-
166
-
167
-
168
-
169
-
170
-
171
-
172
-
173
-
174
-
175
-
176
-
177
-
178
-
179
-
180
-
181
-
182
-
183
-
184
-
185
-
186
-
187
-
188
-
189
-
190
-
191
-
192
-
193
-
194
-
195
-
196
-
197
-
198
-
199
-
200
-
201
-
202
-
203
-
204
-
205
-
206
-
207
-
208
-
209
-
210
-
211
-
212
-
213
-
214
-
215
-
216
-
217
-
218
-
219
-
220
-
221
-
222
-
223
-
224
-
225
-
226
-
227
-
228
-
229
-
230
-
231
-
232
-
233
-
234
-
235
-
236
-
237
-
238
-
239
-
240
-
241
-
242
-
243
-
244
-
245
-
246
-
247
-
248
-
249
-
250
-
251
-
252
-
253
-
254
-
255
-
256
-
257
-
258
-
259
-
260
-
261
-
262
-
263
-
264
-
265
-
266
-
267
-
268
-
269
-
270
-
271
-
272
-
273
 |
 |

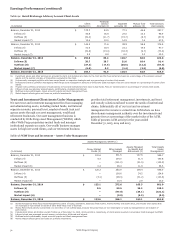
Earnings Performance (continued)
Table 9e: Retail Brokerage Advisory Account Client Assets
(in billions)
Client
directed (1)
Financial
advisor
directed (2)
Separate
accounts (3)
Mutual fund
advisory (4)
Total advisory
client assets
Balance, December 31, 2012 $ 119.3 54.5 77.1 46.8 297.7
Inflows (5)
Outflows (6)
Market impact (7)
42.8
(31.2)
13.6
16.8
(11.7)
12.0
24.0
(15.7)
14.5
13.3
(8.7)
7.4
96.9
(67.3)
47.5
Balance, December 31, 2013 $ 144.5 71.6 99.9 58.8 374.8
Inflows (5)
Outflows (6)
Market impact (7)
41.6
(31.8)
5.5
18.4
(13.4)
8.8
23.1
(18.3)
6.0
14.6
(9.7)
3.2
97.7
(73.2)
23.5
Balance, December 31, 2014 $ 159.8 85.4 110.7 66.9 422.8
Inflows (5)
Outflows (6)
Market impact (7)
38.7
(37.3)
(6.5)
20.7
(17.5)
3.3
21.6
(20.5)
(1.4)
10.4
(12.2)
(2.2)
91.4
(87.5)
(6.8)
Balance, December 31, 2015 $ 154.7 91.9 110.4 62.9 419.9
(1) Investment advice and other services are provided to client, but decisions are made by the client and the fees earned are based on a percentage of the advisory account
assets, not the number and size of transactions executed by the client.
(2) Professionally managed portfolios with fees earned based on respective strategies and as a percentage of certain client assets.
(3) Professional advisory portfolios managed by Wells Fargo asset management advisors or third-party asset managers. Fees are earned based on a percentage of certain client
assets.
(4) Program with portfolios constructed of load-waived, no-load and institutional share class mutual funds. Fees are earned based on a percentage of certain client assets.
(5) Inflows include new advisory account assets, contributions, dividends and interest.
(6) Outflows include withdrawals, closed accounts’ assets and client management fees.
(7) Market impact reflects gains and losses on portfolio investments.
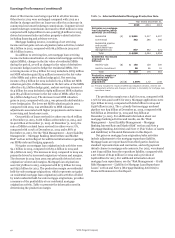
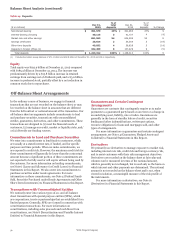
Trust and Investment Client Assets Under Management provides total retirement management, investments, and trust
We earn trust and investment management fees from managing and custody solutions tailored to meet the needs of institutional
and administering assets, including mutual funds, institutional clients. Substantially all of our trust and investment
separate accounts, personal trust, employee benefit trust and management fee income is earned from AUM where we have
agency assets through our asset management, wealth and discretionary management authority over the investments and
retirement businesses. Our asset management business is generate fees as a percentage of the market value of the AUM.
conducted by Wells Fargo Asset Management (WFAM), which Table 9f presents AUM activity for the years ended
offers Wells Fargo proprietary mutual funds and manages December 31, 2015, 2014 and 2013.
institutional separate accounts. Our wealth business manages
assets for high net worth clients, and our retirement business
Table 9f: WIM Trust and Investment – Assets Under Management
Assets Managed by WFAM (1)
(in billions)
Money Market
Funds (2)
Other Assets
Managed
Assets Managed
by Wealth and
Retirement (3)
Total Assets
Under
Management
Balance, December 31, 2012
Inflows (4)
Outflows (5)
Market impact (6)
$ 120.6
5.4
—
0.2
331.5
104.0
(101.0)
26.4
147.6
31.4
(31.5)
11.9
599.7
140.8
(132.5)
38.5
Balance, December 31, 2013 $ 126.2 360.9 159.4 646.5
Inflows (4) — 100.6 34.2 134.8
Outflows (5) (3.1) (99.3) (31.2) (133.6)
Market impact (6) — 10.4 2.9 13.3
Balance, December 31, 2014 $ 123.1 372.6 165.3 661.0
Inflows (4) 0.5 93.5 36.2 130.2
Outflows (5) — (97.0) (34.1) (131.1)
Market impact (6) — (3.0) (5.3) (8.3)
Balance, December 31, 2015 $ 123.6 366.1 162.1 651.8
(1) Assets managed by Wells Fargo Asset Management consist of equity, alternative, balanced, fixed income, money market, and stable value, and include client assets that
are managed or sub-advised on behalf of other Wells Fargo lines of business.
(2) Money Market fund activity is presented on a net inflow or net outflow basis, because the gross flows are not meaningful nor used by management as an indicator of
performance.
(3) Includes $8.2 billion, $8.9 billion and $8.7 billion as of December 31, 2015, 2014 and 2013, respectively, of client assets invested in proprietary funds managed by WFAM.
(4) Inflows include new managed account assets, contributions, dividends and interest.
(5) Outflows include withdrawals, closed accounts’ assets and client management fees.
(6) Market impact reflects gains and losses on portfolio investments.
Wells Fargo & Company
52