Wells Fargo 2015 Annual Report Download - page 5
Download and view the complete annual report
Please find page 5 of the 2015 Wells Fargo annual report below. You can navigate through the pages in the report by either clicking on the pages listed below, or by using the keyword search tool below to find specific information within the annual report.-
 1
1 -
 2
2 -
 3
3 -
 4
4 -
 5
5 -
 6
6 -
 7
7 -
 8
8 -
 9
9 -
 10
10 -
 11
11 -
 12
12 -
 13
13 -
 14
14 -
 15
15 -
 16
16 -
17
-
18
-
19
-
20
-
21
-
22
-
23
-
24
-
25
-
26
-
27
-
28
-
29
-
30
-
31
-
32
-
33
-
34
-
35
-
36
-
37
-
38
-
39
-
40
-
41
-
42
-
43
-
44
-
45
-
46
-
47
-
48
-
49
-
50
-
51
-
52
-
53
-
54
-
55
-
56
-
57
-
58
-
59
-
60
-
61
-
62
-
63
-
64
-
65
-
66
-
67
-
68
-
69
-
70
-
71
-
72
-
73
-
74
-
75
-
76
-
77
-
78
-
79
-
80
-
81
-
82
-
83
-
84
-
85
-
86
-
87
-
88
-
89
-
90
-
91
-
92
-
93
-
94
-
95
-
96
-
97
-
98
-
99
-
100
-
101
-
102
-
103
-
104
-
105
-
106
-
107
-
108
-
109
-
110
-
111
-
112
-
113
-
114
-
115
-
116
-
117
-
118
-
119
-
120
-
121
-
122
-
123
-
124
-
125
-
126
-
127
-
128
-
129
-
130
-
131
-
132
-
133
-
134
-
135
-
136
-
137
-
138
-
139
-
140
-
141
-
142
-
143
-
144
-
145
-
146
-
147
-
148
-
149
-
150
-
151
-
152
-
153
-
154
-
155
-
156
-
157
-
158
-
159
-
160
-
161
-
162
-
163
-
164
-
165
-
166
-
167
-
168
-
169
-
170
-
171
-
172
-
173
-
174
-
175
-
176
-
177
-
178
-
179
-
180
-
181
-
182
-
183
-
184
-
185
-
186
-
187
-
188
-
189
-
190
-
191
-
192
-
193
-
194
-
195
-
196
-
197
-
198
-
199
-
200
-
201
-
202
-
203
-
204
-
205
-
206
-
207
-
208
-
209
-
210
-
211
-
212
-
213
-
214
-
215
-
216
-
217
-
218
-
219
-
220
-
221
-
222
-
223
-
224
-
225
-
226
-
227
-
228
-
229
-
230
-
231
-
232
-
233
-
234
-
235
-
236
-
237
-
238
-
239
-
240
-
241
-
242
-
243
-
244
-
245
-
246
-
247
-
248
-
249
-
250
-
251
-
252
-
253
-
254
-
255
-
256
-
257
-
258
-
259
-
260
-
261
-
262
-
263
-
264
-
265
-
266
-
267
-
268
-
269
-
270
-
271
-
272
-
273
 |
 |

2015 Annual Report|
Earning lifelong relationships,
one customer at a time, is fundamental
to achieving our vision, which is to
“satisfy our customers’ financial needs
and help them succeed financially.”
Whether we’re helping a student open
a first checking account, a young
family purchase a home, a business
owner expand, or a retiree manage
investments, we are on our customers’
side, oering them the products
and services they want and need.
We believe the best way we can
earn our customers’ business is
to listen and understand their needs.
Consider Biltmore, one of America’s
most beautiful historic estates
and a popular tourist attraction,
built by George Vanderbilt in 1895
in the Blue Ridge Mountains
of North Carolina. At the turn
of the 20th century, the Vanderbilt
family used Wells Fargo for transport
along the East Coast, and they later
formed a banking relationship with
us. Through listening to and working
with The Biltmore Company, we have
provided loans and financial services
to help the business grow. Today,
Biltmore draws more than 1.4 million
visitors annually and includes not
only an inn and hotel, but also
a village with restaurants and retail
shops, a winery, branded retail
products, and a solar farm.
Earning relationships and helping
customers like The Biltmore Company
are the core of our business. We are
honored to have relationships with
one in three U.S. households. We lend
more money to help individuals and
families buy homes than any other
American company. We are the nation’s
top lender to small businesses, based
on Community Reinvestment Act data.
We are the largest lender
to mid-sized companies, and we
help large companies with their
domestic and global needs through
our oces in 36 countries.
Our leading position across many
of our businesses is important because
it reflects how well we are serving our
customers — individuals, households,
businesses, and corporations —
who make up the “real economy.”
We never take for granted the trust
our customers have placed in us,
and we understand the important
role we play in helping grow the U.S.
economy. If we serve our customers
well and manage our business
eectively and eciently, we also
will grow and succeed as a company.
As we like to say, we never put the
stagecoach ahead of the horses!
We never take for
granted the trust
our customers have
placed in us, and
we understand the
important role we
play in helping grow
the U.S. economy.
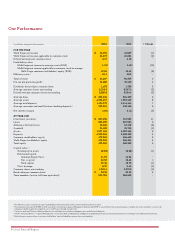
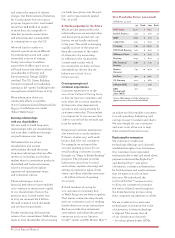
Financial results
Our focus on customers, as well
as our diversified business model
and strong risk discipline, helped
us to produce another solid year
of financial performance in 2015,
even as we navigated the pressures
of low interest rates and global
economic volatility.
Wells Fargo generated $86.1 billion
in revenue in 2015, up 2 percent from
2014. Our time-tested business model
— which produced a balanced mix
of net interest income and noninterest
income across more than 90 businesses
— allowed us to deliver consistent
performance despite the challenging
environment.
Our 2015 net income was $22.9 billion,
and our diluted earnings per common
share of $4.12 represented a $0.02
increase from 2014. Our 2015 return
on assets was 1.31 percent, and our
return on equity was 12.60 percent.
At year-end, our total deposits reached
a record $1.2 trillion, up 5 percent from
the prior year, driven by both consumer
and commercial growth. Total loans
finished 2015 at $916.6 billion,
up 6 percent from 2014, making our
loan portfolio the largest among U.S.
banks. We saw growth in commercial
loans, residential mortgages, credit
cards, and automobile lending while
maintaining our strong credit and
pricing discipline.
In fact, the credit quality of our
portfolio proved to be about as good as
I’ve seen in my 34 years at Wells Fargo.
Credit losses of $2.9 billion improved
2 percent from 2014. Net charge-os
as a percentage of average loans
remained near historic lows —
0.33 percent in 2015, compared
with 0.35 percent in 2014.
We also continued to strengthen
our balance sheet in 2015 and ended
the year with our highest-ever levels
of capital and liquidity. We finished
2015 with total equity of $193.9 billion,
Common Equity Tier 1 capital
of $142.4 billion, and a Common
Equity Tier 1 ratio (fully phased-in)
of 10.77 percent.1
1 For more information on our regulatory capital and related ratios, please see the “Financial Review — Capital Management” section in this Report.