Wells Fargo 2015 Annual Report Download - page 152
Download and view the complete annual report
Please find page 152 of the 2015 Wells Fargo annual report below. You can navigate through the pages in the report by either clicking on the pages listed below, or by using the keyword search tool below to find specific information within the annual report.-
 1
1 -
2
-
3
-
4
-
5
-
6
-
7
-
8
-
9
-
10
-
11
-
12
-
13
-
14
-
15
-
16
-
17
-
18
-
19
-
20
-
21
-
22
-
23
-
24
-
25
-
26
-
27
-
28
-
29
-
30
-
31
-
32
-
33
-
34
-
35
-
36
-
37
-
38
-
39
-
40
-
41
-
42
-
43
-
44
-
45
-
46
-
47
-
48
-
49
-
50
-
51
-
52
-
53
-
54
-
55
-
56
-
57
-
58
-
59
-
60
-
61
-
62
-
63
-
64
-
65
-
66
-
67
-
68
-
69
-
70
-
71
-
72
-
73
-
74
-
75
-
76
-
77
-
78
-
79
-
80
-
81
-
82
-
83
-
84
-
85
-
86
-
87
-
88
-
89
-
90
-
91
-
92
-
93
-
94
-
95
-
96
-
97
-
98
-
99
-
100
-
101
-
102
-
103
-
104
-
105
-
106
-
107
-
108
-
109
-
110
-
111
-
112
-
113
-
114
-
115
-
116
-
117
-
118
-
119
-
120
-
121
-
122
-
123
-
124
-
125
-
126
-
127
-
128
-
129
-
130
-
131
-
132
-
133
-
134
-
135
-
136
-
137
-
138
-
139
-
140
-
141
-
 142
142 -
 143
143 -
 144
144 -
 145
145 -
 146
146 -
 147
147 -
 148
148 -
 149
149 -
 150
150 -
 151
151 -
 152
152 -
 153
153 -
 154
154 -
 155
155 -
 156
156 -
 157
157 -
 158
158 -
 159
159 -
 160
160 -
 161
161 -
 162
162 -
163
-
164
-
165
-
166
-
167
-
168
-
169
-
170
-
171
-
172
-
173
-
174
-
175
-
176
-
177
-
178
-
179
-
180
-
181
-
182
-
183
-
184
-
185
-
186
-
187
-
188
-
189
-
190
-
191
-
192
-
193
-
194
-
195
-
196
-
197
-
198
-
199
-
200
-
201
-
202
-
203
-
204
-
205
-
206
-
207
-
208
-
209
-
210
-
211
-
212
-
213
-
214
-
215
-
216
-
217
-
218
-
219
-
220
-
221
-
222
-
223
-
224
-
225
-
226
-
227
-
228
-
229
-
230
-
231
-
232
-
233
-
234
-
235
-
236
-
237
-
238
-
239
-
240
-
241
-
242
-
243
-
244
-
245
-
246
-
247
-
248
-
249
-
250
-
251
-
252
-
253
-
254
-
255
-
256
-
257
-
258
-
259
-
260
-
261
-
262
-
263
-
264
-
265
-
266
-
267
-
268
-
269
-
270
-
271
-
272
-
273
 |
 |

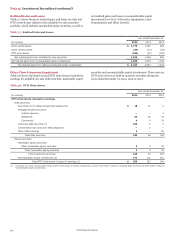
Note 1: Summary of Significant Accounting Policies (continued)
SUPPLEMENTAL CASH FLOW INFORMATION Noncash
activities are presented in Table 1.1, including information on
transfers affecting MHFS, LHFS, and MSRs.
Table 1.1: Supplemental Cash Flow Information
Year ended December 31,
(in millions) 2015 2014 2013
Trading assets retained from securitizations of MHFS
Capitalization of MSRs from sale of MHFS
Transfers from loans to MHFS
Transfers from loans to LHFS
Transfers from loans to foreclosed and other assets
Transfers from available-for-sale to held-to-maturity securities
$ 46,291
1,736
9,205
90
3,274
4,972
28,604
1,302
11,021
9,849
4,094
1,810
47,198
3,616
7,610
274
4,470
6,042
SUBSEQUENT EVENTS We have evaluated the effects of events
that have occurred subsequent to December 31, 2015, and there
have been no material events that would require recognition in
our 2015 consolidated financial statements or disclosure in the
Notes to the consolidated financial statements, except for a
business acquisition completed on January 1, 2016, as discussed
in Note 2 (Business Combinations). Additionally, on February 1,
2016, and subsequent to the announcement of our 2015 financial
results on January 15, 2016, we reached an agreement in
principle with the Federal Government to pay $1.2 billion to
resolve certain civil claims related to our Federal Housing
Administration lending activities. This agreement was
considered to be a recognizable subsequent event under GAAP
and required adjustment to our December 31, 2015 consolidated
financial statements. Accordingly, we provided for an additional
legal accrual that increased operating losses within noninterest
expense by $200 million and, as a result, reduced net income for
the year ended December 31, 2015, by $134 million, or $0.03 per
common share. See Note 15 (Legal Actions) for additional
information.
Wells Fargo & Company
150