Wells Fargo 2015 Annual Report Download - page 85
Download and view the complete annual report
Please find page 85 of the 2015 Wells Fargo annual report below. You can navigate through the pages in the report by either clicking on the pages listed below, or by using the keyword search tool below to find specific information within the annual report.-
 1
1 -
2
-
3
-
4
-
5
-
6
-
7
-
8
-
9
-
10
-
11
-
12
-
13
-
14
-
15
-
16
-
17
-
18
-
19
-
20
-
21
-
22
-
23
-
24
-
25
-
26
-
27
-
28
-
29
-
30
-
31
-
32
-
33
-
34
-
35
-
36
-
37
-
38
-
39
-
40
-
41
-
42
-
43
-
44
-
45
-
46
-
47
-
48
-
49
-
50
-
51
-
52
-
53
-
54
-
55
-
56
-
57
-
58
-
59
-
60
-
61
-
62
-
63
-
64
-
65
-
66
-
67
-
68
-
69
-
70
-
71
-
72
-
73
-
74
-
 75
75 -
 76
76 -
 77
77 -
 78
78 -
 79
79 -
 80
80 -
 81
81 -
 82
82 -
 83
83 -
 84
84 -
 85
85 -
 86
86 -
 87
87 -
 88
88 -
 89
89 -
 90
90 -
 91
91 -
 92
92 -
 93
93 -
 94
94 -
 95
95 -
96
-
97
-
98
-
99
-
100
-
101
-
102
-
103
-
104
-
105
-
106
-
107
-
108
-
109
-
110
-
111
-
112
-
113
-
114
-
115
-
116
-
117
-
118
-
119
-
120
-
121
-
122
-
123
-
124
-
125
-
126
-
127
-
128
-
129
-
130
-
131
-
132
-
133
-
134
-
135
-
136
-
137
-
138
-
139
-
140
-
141
-
142
-
143
-
144
-
145
-
146
-
147
-
148
-
149
-
150
-
151
-
152
-
153
-
154
-
155
-
156
-
157
-
158
-
159
-
160
-
161
-
162
-
163
-
164
-
165
-
166
-
167
-
168
-
169
-
170
-
171
-
172
-
173
-
174
-
175
-
176
-
177
-
178
-
179
-
180
-
181
-
182
-
183
-
184
-
185
-
186
-
187
-
188
-
189
-
190
-
191
-
192
-
193
-
194
-
195
-
196
-
197
-
198
-
199
-
200
-
201
-
202
-
203
-
204
-
205
-
206
-
207
-
208
-
209
-
210
-
211
-
212
-
213
-
214
-
215
-
216
-
217
-
218
-
219
-
220
-
221
-
222
-
223
-
224
-
225
-
226
-
227
-
228
-
229
-
230
-
231
-
232
-
233
-
234
-
235
-
236
-
237
-
238
-
239
-
240
-
241
-
242
-
243
-
244
-
245
-
246
-
247
-
248
-
249
-
250
-
251
-
252
-
253
-
254
-
255
-
256
-
257
-
258
-
259
-
260
-
261
-
262
-
263
-
264
-
265
-
266
-
267
-
268
-
269
-
270
-
271
-
272
-
273
 |
 |

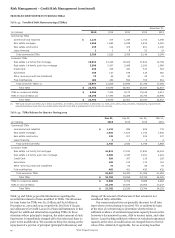
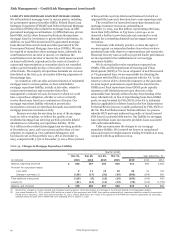
NET CHARGE-OFFS
Table 37: Net Charge-offs
Year ended Quarter ended
December 31, December 31, September 30, June 30, March 31,
Net loan % of Net loan % of Net loan % of Net loan % of Net loan % of
charge- avg. charge- avg. charge- avg. charge- avg. charge- avg.
($ in millions) offs loans offs loans (1) offs loans (1) offs loans (1) offs loans (1)
2015
Commercial:
Commercial and industrial $ 482 0.17% $ 215 0.29% $ 122 0.17% $ 81 0.12% $ 64 0.10%
Real estate mortgage (68) (0.06) (19) (0.06) (23) (0.08) (15) (0.05) (11) (0.04)
Real estate construction (33) (0.16) (10) (0.18) (8) (0.15) (6) (0.11) (9) (0.19)
Lease financing 6 0.05 1 0.01 3 0.11 2 0.06 — —
Total commercial 387 0.09 187 0.16 94 0.08 62 0.06 44 0.04
Consumer:
Real estate 1-4 family first
mortgage 262 0.10 50 0.07 62 0.09 67 0.10 83 0.13
Real estate 1-4 family
junior lien mortgage 376 0.67 70 0.52 89 0.64 94 0.66 123 0.85
Credit card 941 3.00 243 2.93 216 2.71 243 3.21 239 3.19
Automobile 417 0.72 135 0.90 113 0.76 68 0.48 101 0.73
Other revolving credit and
installment 509 1.36 146 1.49 129 1.35 116 1.26 118 1.32
Total consumer 2,505 0.55 644 0.56 609 0.53 588 0.53 664 0.60
Total $ 2,892 0.33% $ 831 0.36% $ 703 0.31% $ 650 0.30% $ 708 0.33%
2014
Commercial:
Commercial and industrial $ 258 0.10 % $ 82 0.12 % $ 67 0.11 % $ 60 0.10 % $ 49 0.08 %
Real estate mortgage (94) (0.08) (25) (0.09) (37) (0.13) (10) (0.04) (22) (0.08)
Real estate construction (127) (0.72) (26) (0.56) (58) (1.27) (20) (0.47) (23) (0.54)
Lease financing 7 0.06 1 0.05 4 0.10 1 0.05 1 0.03
Total commercial 44 0.01 32 0.03 (24) 0.02 31 0.03 5 0.01
Consumer:
Real estate 1-4 family first
mortgage 509 0.19 88 0.13 114 0.17 137 0.21 170 0.27
Real estate 1-4 family junior
lien mortgage 626 1.00 134 0.88 140 0.90 160 1.02 192 1.19
Credit card 864 3.14 221 2.97 201 2.87 211 3.20 231 3.57
Automobile 380 0.70 132 0.94 112 0.81 46 0.35 90 0.70
Other revolving credit and
installment 522 1.35 128 1.45 125 1.46 132 1.22 137 1.29
Total consumer 2,901 0.65 703 0.63 692 0.62 686 0.62 820 0.75
Total $ 2,945 0.35 % $ 735 0.34 % $ 668 0.32 % $ 717 0.35 % $ 825 0.41 %
(1) Quarterly net charge-offs (recoveries) as a percentage of average respective loans are annualized.
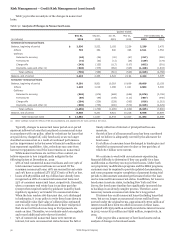
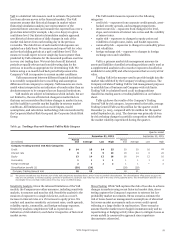
Table 37 presents net charge-offs for the four quarters and full
year of 2015 and 2014. Net charge-offs in 2015 were $2.9 billion
(0.33% of average total loans outstanding) compared with
$2.9 billion (0.35%) in 2014. The increase in commercial and
industrial net charge-offs in 2015 reflected continued
deterioration within the oil and gas portfolio. Our commercial
real estate portfolios were in a net recovery position every
quarter in 2015 and 2014. We continued to have strong credit
improvement in our residential real estate secured portfolios,
benefiting from improvement in the housing market, with losses
down $497 million, or 44%, from 2014.
Wells Fargo & Company
83