Wells Fargo 2015 Annual Report Download - page 231
Download and view the complete annual report
Please find page 231 of the 2015 Wells Fargo annual report below. You can navigate through the pages in the report by either clicking on the pages listed below, or by using the keyword search tool below to find specific information within the annual report.-
 1
1 -
2
-
3
-
4
-
5
-
6
-
7
-
8
-
9
-
10
-
11
-
12
-
13
-
14
-
15
-
16
-
17
-
18
-
19
-
20
-
21
-
22
-
23
-
24
-
25
-
26
-
27
-
28
-
29
-
30
-
31
-
32
-
33
-
34
-
35
-
36
-
37
-
38
-
39
-
40
-
41
-
42
-
43
-
44
-
45
-
46
-
47
-
48
-
49
-
50
-
51
-
52
-
53
-
54
-
55
-
56
-
57
-
58
-
59
-
60
-
61
-
62
-
63
-
64
-
65
-
66
-
67
-
68
-
69
-
70
-
71
-
72
-
73
-
74
-
75
-
76
-
77
-
78
-
79
-
80
-
81
-
82
-
83
-
84
-
85
-
86
-
87
-
88
-
89
-
90
-
91
-
92
-
93
-
94
-
95
-
96
-
97
-
98
-
99
-
100
-
101
-
102
-
103
-
104
-
105
-
106
-
107
-
108
-
109
-
110
-
111
-
112
-
113
-
114
-
115
-
116
-
117
-
118
-
119
-
120
-
121
-
122
-
123
-
124
-
125
-
126
-
127
-
128
-
129
-
130
-
131
-
132
-
133
-
134
-
135
-
136
-
137
-
138
-
139
-
140
-
141
-
142
-
143
-
144
-
145
-
146
-
147
-
148
-
149
-
150
-
151
-
152
-
153
-
154
-
155
-
156
-
157
-
158
-
159
-
160
-
161
-
162
-
163
-
164
-
165
-
166
-
167
-
168
-
169
-
170
-
171
-
172
-
173
-
174
-
175
-
176
-
177
-
178
-
179
-
180
-
181
-
182
-
183
-
184
-
185
-
186
-
187
-
188
-
189
-
190
-
191
-
192
-
193
-
194
-
195
-
196
-
197
-
198
-
199
-
200
-
201
-
202
-
203
-
204
-
205
-
206
-
207
-
208
-
209
-
210
-
211
-
212
-
213
-
214
-
215
-
216
-
217
-
218
-
219
-
220
-
 221
221 -
 222
222 -
 223
223 -
 224
224 -
 225
225 -
 226
226 -
 227
227 -
 228
228 -
 229
229 -
 230
230 -
 231
231 -
 232
232 -
 233
233 -
 234
234 -
 235
235 -
 236
236 -
 237
237 -
 238
238 -
 239
239 -
 240
240 -
 241
241 -
242
-
243
-
244
-
245
-
246
-
247
-
248
-
249
-
250
-
251
-
252
-
253
-
254
-
255
-
256
-
257
-
258
-
259
-
260
-
261
-
262
-
263
-
264
-
265
-
266
-
267
-
268
-
269
-
270
-
271
-
272
-
273
 |
 |

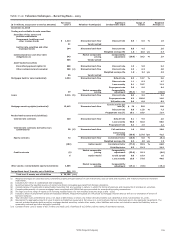
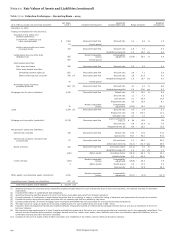
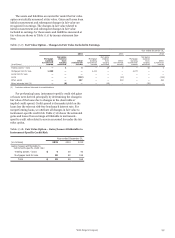
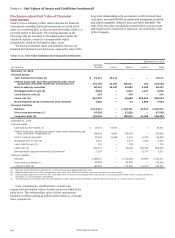
Table 17.10: Valuation Techniques – Recurring Basis – 2015
($ in millions, except cost to service amounts)
Fair Value
Level 3 Valuation Technique(s)
Significant
Unobservable Input
Range of
Inputs
Weighted
Average (1)
December 31, 2015
Trading and available-for-sale securities:
Securities of U.S. states and
political subdivisions:
Government, healthcare and
other revenue bonds $ 1,213 Discounted cash flow Discount rate 0.8 -5.6 % 1.9
51 Vendor priced
Auction rate securities and other
municipal bonds 244 Discounted cash flow Discount rate 0.8 -4.5 2.0
Weighted average life 1.0 -10.0 yrs 4.7
Collateralized loan and other debt Market comparable Comparability
obligations (2) 343 pricing adjustment (20.0) -20.3 % 2.9
565 Vendor priced
Asset-backed securities:
Diversified payment rights (3) 608 Discounted cash flow Discount rate 1.0 -5.0 3.2
Other commercial and consumer 508 (4) Discounted cash flow Discount rate 2.5 -6.3 3.8
Weighted average life 1.0 -9.4 yrs 4.3
66 Vendor priced
Mortgages held for sale (residential) 1,033 Discounted cash flow Default rate 0.5 -13.7 % 3.6
Discount rate 1.1 -6.3 4.7
Loss severity 0.1 -22.7 11.2
Prepayment rate 2.6 -9.6 6.4
Market comparable Comparability
49 pricing adjustment (53.3) -0.0 (32.6)
Loans 5,316 (5) Discounted cash flow Discount rate 0.0 -3.9 3.1
Prepayment rate 0.2 -100.0 14.6
Utilization rate 0.0 -0.8 0.3
Mortgage servicing rights (residential) 12,415 Discounted cash flow
Cost to service per
loan (6) $ 70 -599 168
Discount rate 6.8 -11.8 % 7.3
Prepayment rate (7) 10.1 -18.9 11.4
Net derivative assets and (liabilities):
Interest rate contracts 230 Discounted cash flow Default rate 0.1 -9.6 2.6
Loss severity 50.0 -50.0 50.0
Prepayment rate 0.3 -2.5 2.2
Interest rate contracts: derivative loan
commitments 58 (8) Discounted cash flow Fall-out factor 1.0 -99.0 18.8
Initial-value
servicing (30.6) -127.0 bps 41.5
Equity contracts 72 Discounted cash flow Conversion factor (10.6) -0.0 % (8.1)
Weighted average life 0.5 -2.0 yrs 1.5
(183) Option model Correlation factor (77.0) -98.5 % 66.0
Volatility factor 6.5 -91.3 24.2
Credit contracts (9)
Market comparable
pricing
Comparability
adjustment (53.6) -18.2 (0.6)
6 Option model Credit spread 0.0 -19.9 1.6
Loss severity 13.0 -73.0 49.6
Other assets: nonmarketable equity investments 3,065 Market comparable
pricing
Comparability
adjustment (19.1) -(5.5) (15.1)
Insignificant Level 3 assets, net of liabilities 516 (9)
Total level 3 assets, net of liabilities $ 26,166 (10)
(1) Weighted averages are calculated using outstanding unpaid principal balance for cash instruments, such as loans and securities, and notional amounts for derivative
instruments.
(2) Includes $257 million of collateralized debt obligations.
(3) Securities backed by specified sources of current and future receivables generated from foreign originators.
(4) Consists largely of investments in asset-backed securities that are revolving in nature, in which the timing of advances and repayments of principal are uncertain.
(5) Consists predominantly of reverse mortgage loans securitized with GNMA that were accounted for as secured borrowing transactions.
(6) The high end of the range of inputs is for servicing modified loans. For non-modified loans the range is $70 - $335.
(7) Includes a blend of prepayment speeds and expected defaults. Prepayment speeds are influenced by mortgage interest rates as well as our estimation of drivers of
borrower behavior.
(8) Total derivative loan commitments were a net asset of $56 million, of which a $2 million derivative liability was classified as level 2 at December 31, 2015.
(9) Represents the aggregate amount of Level 3 assets and liabilities measured at fair value on a recurring basis that are individually and in the aggregate insignificant. The
amount includes corporate debt securities, mortgage-backed securities, certain other assets, other liabilities and certain net derivative assets and liabilities, such as
commodity contracts and other derivative contracts.
(10) Consists of total Level 3 assets of $27.7 billion and total Level 3 liabilities of $1.5 billion, before netting of derivative balances.
Wells Fargo & Company
229