Wells Fargo 2015 Annual Report Download - page 95
Download and view the complete annual report
Please find page 95 of the 2015 Wells Fargo annual report below. You can navigate through the pages in the report by either clicking on the pages listed below, or by using the keyword search tool below to find specific information within the annual report.-
 1
1 -
2
-
3
-
4
-
5
-
6
-
7
-
8
-
9
-
10
-
11
-
12
-
13
-
14
-
15
-
16
-
17
-
18
-
19
-
20
-
21
-
22
-
23
-
24
-
25
-
26
-
27
-
28
-
29
-
30
-
31
-
32
-
33
-
34
-
35
-
36
-
37
-
38
-
39
-
40
-
41
-
42
-
43
-
44
-
45
-
46
-
47
-
48
-
49
-
50
-
51
-
52
-
53
-
54
-
55
-
56
-
57
-
58
-
59
-
60
-
61
-
62
-
63
-
64
-
65
-
66
-
67
-
68
-
69
-
70
-
71
-
72
-
73
-
74
-
75
-
76
-
77
-
78
-
79
-
80
-
81
-
82
-
83
-
84
-
 85
85 -
 86
86 -
 87
87 -
 88
88 -
 89
89 -
 90
90 -
 91
91 -
 92
92 -
 93
93 -
 94
94 -
 95
95 -
 96
96 -
 97
97 -
 98
98 -
 99
99 -
 100
100 -
 101
101 -
 102
102 -
 103
103 -
 104
104 -
 105
105 -
106
-
107
-
108
-
109
-
110
-
111
-
112
-
113
-
114
-
115
-
116
-
117
-
118
-
119
-
120
-
121
-
122
-
123
-
124
-
125
-
126
-
127
-
128
-
129
-
130
-
131
-
132
-
133
-
134
-
135
-
136
-
137
-
138
-
139
-
140
-
141
-
142
-
143
-
144
-
145
-
146
-
147
-
148
-
149
-
150
-
151
-
152
-
153
-
154
-
155
-
156
-
157
-
158
-
159
-
160
-
161
-
162
-
163
-
164
-
165
-
166
-
167
-
168
-
169
-
170
-
171
-
172
-
173
-
174
-
175
-
176
-
177
-
178
-
179
-
180
-
181
-
182
-
183
-
184
-
185
-
186
-
187
-
188
-
189
-
190
-
191
-
192
-
193
-
194
-
195
-
196
-
197
-
198
-
199
-
200
-
201
-
202
-
203
-
204
-
205
-
206
-
207
-
208
-
209
-
210
-
211
-
212
-
213
-
214
-
215
-
216
-
217
-
218
-
219
-
220
-
221
-
222
-
223
-
224
-
225
-
226
-
227
-
228
-
229
-
230
-
231
-
232
-
233
-
234
-
235
-
236
-
237
-
238
-
239
-
240
-
241
-
242
-
243
-
244
-
245
-
246
-
247
-
248
-
249
-
250
-
251
-
252
-
253
-
254
-
255
-
256
-
257
-
258
-
259
-
260
-
261
-
262
-
263
-
264
-
265
-
266
-
267
-
268
-
269
-
270
-
271
-
272
-
273
 |
 |

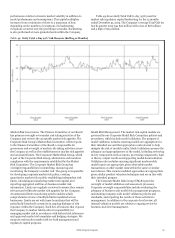
VaR is a statistical risk measure used to estimate the potential The VaR models measure exposure to the following
loss from adverse moves in the financial markets. The VaR categories:
measures assume that historical changes in market values
(historical simulation analysis) are representative of the
potential future outcomes and measure the expected loss over a
given time interval (for example, 1 day or 10 days) at a given
confidence level. Our historical simulation analysis approach
uses historical observations of daily changes in each of the
market risk factors from each trading day in the previous
12 months. The risk drivers of each market risk exposure are
updated on a daily basis. We measure and report VaR for 1-day
and 10-day holding periods at a 99% confidence level. This
means we would expect to incur single day losses greater than
predicted by VaR estimates for the measured positions one time
in every 100 trading days. We treat data from all historical
periods as equally relevant and consider using data for the
previous 12 months as appropriate for determining VaR. We
believe using a 12-month look back period helps ensure the
Company’s VaR is responsive to current market conditions.
VaR measurement between different financial institutions
is not readily comparable due to modeling and assumption
differences from company to company. VaR measures are more
useful when interpreted as an indication of trends rather than an
absolute measure to be compared across financial institutions.
VaR models are subject to limitations which include, but are
not limited to, the use of historical changes in market factors
that may not accurately reflect future changes in market factors,
and the inability to predict market liquidity in extreme market
conditions. All limitations such as model inputs, model
assumptions, and calculation methodology risk are monitored by
the Corporate Market Risk Group and the Corporate Model Risk
Group.
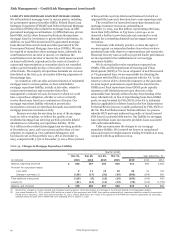
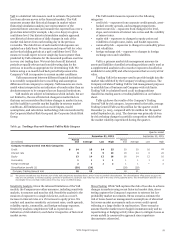
Table 43: Trading 1-Day 99% General VaR by Risk Category
• credit risk – exposures from corporate credit spreads, asset-
backed security spreads, and mortgage prepayments.
• interest rate risk – exposures from changes in the level,
slope, and curvature of interest rate curves and the volatility
of interest rates.
• equity risk – exposures to changes in equity prices and
volatilities of single name, index, and basket exposures.
• commodity risk – exposures to changes in commodity prices
and volatilities.
• foreign exchange risk – exposures to changes in foreign
exchange rates and volatilities.
VaR is a primary market risk management measure for
assets and liabilities classified as trading positions and is used as
a supplemental analysis tool to monitor exposures classified as
available for sale (AFS) and other exposures that we carry at fair
value.
Trading VaR is the measure used to provide insight into the
market risk exhibited by the Company’s trading positions. The
Company calculates Trading VaR for risk management purposes
to establish line of business and Company-wide risk limits.
Trading VaR is calculated based on all trading positions
classified as trading assets or trading liabilities on our balance
sheet.
Table 43 shows the results of the Company’s Trading
General VaR by risk category. As presented in the table, average
Trading General VaR was $19 million for the quarter ended
December 31, 2015, compared with $21 million for the quarter
ended September 30, 2015. The decrease was primarily driven
by risk reducing changes in portfolio composition which offset
the market volatility experienced during the quarter.
Quarter ended
December 31, 2015 September 30, 2015
Period Period
(in millions) end Average Low High end Average Low High
Company Trading General VaR Risk Categories
Credit $ 14 18 14 25 20 20 16 24
Interest rate 8 9 5 13 18 14 6 22
Equity 13 14 12 16 16 14 12 16
Commodity 1 1 1 1 1 1 1 2
Foreign exchange 2 1 1 2 1 1 — 2
Diversification benefit (1) (20) (24) (38) (29)
Company Trading General VaR 18 19 18 21
(1) The period-end VaR was less than the sum of the VaR components described above, which is due to portfolio diversification. The diversification effect arises because the
risks are not perfectly correlated causing a portfolio of positions to usually be less risky than the sum of the risks of the positions alone. The diversification benefit is not
meaningful for low and high metrics since they may occur on different days.
Sensitivity Analysis Given the inherent limitations of the VaR Stress Testing While VaR captures the risk of loss due to adverse
models, the Company uses other measures, including sensitivity changes in markets using recent historical market data, stress
analysis, to measure and monitor risk. Sensitivity analysis is the testing captures the Company’s exposure to extreme but low
measure of exposure to a single risk factor, such as a 0.01% probability market movements. Stress scenarios estimate the
increase in interest rates or a 1% increase in equity prices. We risk of losses based on management’s assumptions of abnormal
conduct and monitor sensitivity on interest rates, credit spreads, but severe market movements such as severe credit spread
volatility, equity, commodity, and foreign exchange exposure. widening or a large decline in equity prices. These scenarios
Sensitivity analysis complements VaR as it provides an assume that the market moves happen instantaneously and no
indication of risk relative to each factor irrespective of historical repositioning or hedging activity takes place to mitigate losses as
market moves. events unfold (a conservative approach since experience
demonstrates otherwise).
Wells Fargo & Company
93