Wells Fargo 2015 Annual Report Download - page 199
Download and view the complete annual report
Please find page 199 of the 2015 Wells Fargo annual report below. You can navigate through the pages in the report by either clicking on the pages listed below, or by using the keyword search tool below to find specific information within the annual report.-
 1
1 -
2
-
3
-
4
-
5
-
6
-
7
-
8
-
9
-
10
-
11
-
12
-
13
-
14
-
15
-
16
-
17
-
18
-
19
-
20
-
21
-
22
-
23
-
24
-
25
-
26
-
27
-
28
-
29
-
30
-
31
-
32
-
33
-
34
-
35
-
36
-
37
-
38
-
39
-
40
-
41
-
42
-
43
-
44
-
45
-
46
-
47
-
48
-
49
-
50
-
51
-
52
-
53
-
54
-
55
-
56
-
57
-
58
-
59
-
60
-
61
-
62
-
63
-
64
-
65
-
66
-
67
-
68
-
69
-
70
-
71
-
72
-
73
-
74
-
75
-
76
-
77
-
78
-
79
-
80
-
81
-
82
-
83
-
84
-
85
-
86
-
87
-
88
-
89
-
90
-
91
-
92
-
93
-
94
-
95
-
96
-
97
-
98
-
99
-
100
-
101
-
102
-
103
-
104
-
105
-
106
-
107
-
108
-
109
-
110
-
111
-
112
-
113
-
114
-
115
-
116
-
117
-
118
-
119
-
120
-
121
-
122
-
123
-
124
-
125
-
126
-
127
-
128
-
129
-
130
-
131
-
132
-
133
-
134
-
135
-
136
-
137
-
138
-
139
-
140
-
141
-
142
-
143
-
144
-
145
-
146
-
147
-
148
-
149
-
150
-
151
-
152
-
153
-
154
-
155
-
156
-
157
-
158
-
159
-
160
-
161
-
162
-
163
-
164
-
165
-
166
-
167
-
168
-
169
-
170
-
171
-
172
-
173
-
174
-
175
-
176
-
177
-
178
-
179
-
180
-
181
-
182
-
183
-
184
-
185
-
186
-
187
-
188
-
 189
189 -
 190
190 -
 191
191 -
 192
192 -
 193
193 -
 194
194 -
 195
195 -
 196
196 -
 197
197 -
 198
198 -
 199
199 -
 200
200 -
 201
201 -
 202
202 -
 203
203 -
 204
204 -
 205
205 -
 206
206 -
 207
207 -
 208
208 -
 209
209 -
210
-
211
-
212
-
213
-
214
-
215
-
216
-
217
-
218
-
219
-
220
-
221
-
222
-
223
-
224
-
225
-
226
-
227
-
228
-
229
-
230
-
231
-
232
-
233
-
234
-
235
-
236
-
237
-
238
-
239
-
240
-
241
-
242
-
243
-
244
-
245
-
246
-
247
-
248
-
249
-
250
-
251
-
252
-
253
-
254
-
255
-
256
-
257
-
258
-
259
-
260
-
261
-
262
-
263
-
264
-
265
-
266
-
267
-
268
-
269
-
270
-
271
-
272
-
273
 |
 |

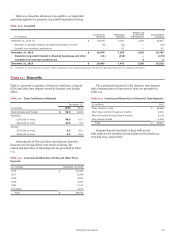
Table 10.3 shows the allocation of goodwill to our reportable
operating segments for purposes of goodwill impairment testing.
Table 10.3: Goodwill
(in millions)
Community
Banking
Wholesale
Banking
Wealth and
Investment
Management
Consolidated
Company
December 31, 2013 (1) $ 16,878 7,557 1,202 25,637
Reduction in goodwill related to divested businesses and other (8) (11) — (19)
Goodwill from business combinations — 87 — 87
December 31, 2014
Reduction in goodwill related to divested businesses and other
Goodwill from business combinations
$ 16,870
(21)
—
7,633
(158)
—
1,202
—
3
25,705
(179)
3
December 31, 2015 $ 16,849 7,475 1,205 25,529
(1) December 31, 2013 has been revised to reflect realignment of our operating segments. See Note 24 (Operating Segments) for additional information.
Note 11: Deposits
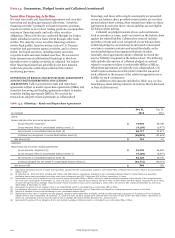
Table 11.1 presents a summary of the time certificates of deposit
(CDs) and other time deposits issued by domestic and foreign
offices.
Table 11.1: Time Certificates of Deposit
December 31,
(in billions) 2015 2014
Total domestic and foreign $ 98.5 124.9
Domestic:
$100,000 or more 48.9 14.7
$250,000 or more 43.0 6.9
Foreign:
$100,000 or more 9.5 16.4
$250,000 or more 9.5 16.4
Substantially all CDs and other time deposits issued by
domestic and foreign offices were interest bearing. The
contractual maturities of these deposits are presented in Table
11.2.
Table 11.2: Contractual Maturities of CDs and Other Time
Deposits
(in millions) December 31, 2015
2016
2017
2018
2019
2020
Thereafter
$ 81,846
5,549
3,643
2,200
1,121
4,155
Total $ 98,514
The contractual maturities of the domestic time deposits
with a denomination of $100,000 or more are presented in
Table 11.3.
Table 11.3: Contractual Maturities of Domestic Time Deposits
(in millions)
Three months or less
After three months through six months
After six months through twelve months
After twelve months
$
2015
36,683
6,010
2,143
4,091
Total $ 48,927
Demand deposit overdrafts of $523 million and
$581 million were included as loan balances at December 31,
2015 and 2014, respectively.
Wells Fargo & Company
197