Wells Fargo 2015 Annual Report Download - page 266
Download and view the complete annual report
Please find page 266 of the 2015 Wells Fargo annual report below. You can navigate through the pages in the report by either clicking on the pages listed below, or by using the keyword search tool below to find specific information within the annual report.-
 1
1 -
2
-
3
-
4
-
5
-
6
-
7
-
8
-
9
-
10
-
11
-
12
-
13
-
14
-
15
-
16
-
17
-
18
-
19
-
20
-
21
-
22
-
23
-
24
-
25
-
26
-
27
-
28
-
29
-
30
-
31
-
32
-
33
-
34
-
35
-
36
-
37
-
38
-
39
-
40
-
41
-
42
-
43
-
44
-
45
-
46
-
47
-
48
-
49
-
50
-
51
-
52
-
53
-
54
-
55
-
56
-
57
-
58
-
59
-
60
-
61
-
62
-
63
-
64
-
65
-
66
-
67
-
68
-
69
-
70
-
71
-
72
-
73
-
74
-
75
-
76
-
77
-
78
-
79
-
80
-
81
-
82
-
83
-
84
-
85
-
86
-
87
-
88
-
89
-
90
-
91
-
92
-
93
-
94
-
95
-
96
-
97
-
98
-
99
-
100
-
101
-
102
-
103
-
104
-
105
-
106
-
107
-
108
-
109
-
110
-
111
-
112
-
113
-
114
-
115
-
116
-
117
-
118
-
119
-
120
-
121
-
122
-
123
-
124
-
125
-
126
-
127
-
128
-
129
-
130
-
131
-
132
-
133
-
134
-
135
-
136
-
137
-
138
-
139
-
140
-
141
-
142
-
143
-
144
-
145
-
146
-
147
-
148
-
149
-
150
-
151
-
152
-
153
-
154
-
155
-
156
-
157
-
158
-
159
-
160
-
161
-
162
-
163
-
164
-
165
-
166
-
167
-
168
-
169
-
170
-
171
-
172
-
173
-
174
-
175
-
176
-
177
-
178
-
179
-
180
-
181
-
182
-
183
-
184
-
185
-
186
-
187
-
188
-
189
-
190
-
191
-
192
-
193
-
194
-
195
-
196
-
197
-
198
-
199
-
200
-
201
-
202
-
203
-
204
-
205
-
206
-
207
-
208
-
209
-
210
-
211
-
212
-
213
-
214
-
215
-
216
-
217
-
218
-
219
-
220
-
221
-
222
-
223
-
224
-
225
-
226
-
227
-
228
-
229
-
230
-
231
-
232
-
233
-
234
-
235
-
236
-
237
-
238
-
239
-
240
-
241
-
242
-
243
-
244
-
245
-
246
-
247
-
248
-
249
-
250
-
251
-
252
-
253
-
254
-
255
-
 256
256 -
 257
257 -
 258
258 -
 259
259 -
 260
260 -
 261
261 -
 262
262 -
 263
263 -
 264
264 -
 265
265 -
 266
266 -
 267
267 -
 268
268 -
 269
269 -
 270
270 -
 271
271 -
 272
272 -
 273
273
 |
 |

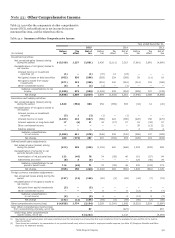
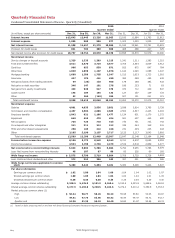
Quarterly Financial Data
Condensed Consolidated Statement of Income - Quarterly (Unaudited)
2015 2014
Quarter ended Quarter ended
(in millions, except per share amounts) Dec 31, Sep 30, Jun 30, Mar 31, Dec 31, Sep 30, Jun 30, Mar 31,
Interest income $12,643 12,445 12,226 11,963 12,183 11,964 11,793 11,612
Interest expense 1,055 988 956 977 1,003 1,023 1,002 997
Net interest income 11,588 11,457 11,270 10,986 11,180 10,941 10,791 10,615
Provision for credit losses 831 703 300 608 485 368 217 325
Net interest income after provision for credit losses 10,757 10,754 10,970 10,378 10,695 10,573 10,574 10,290
Noninterest income
Service charges on deposit accounts 1,329 1,335 1,289 1,215 1,241 1,311 1,283 1,215
Trust and investment fees 3,511 3,570 3,710 3,677 3,705 3,554 3,609 3,412
Card fees 966 953 930 871 925 875 847 784
Other fees 1,040 1,099 1,107 1,078 1,124 1,090 1,088 1,047
Mortgage banking 1,660 1,589 1,705 1,547 1,515 1,633 1,723 1,510
Insurance 427 376 461 430 382 388 453 432
Net gains (losses) from trading activities 99 (26) 133 408 179 168 382 432
Net gains on debt securities 346 147 181 278 186 253 71 83
Net gains from equity investments 423 920 517 370 372 712 449 847
Lease income 145 189 155 132 127 137 129 133
Other 52 266 (140) 286 507 151 241 115
Total noninterest income 9,998 10,418 10,048 10,292 10,263 10,272 10,275 10,010
Noninterest expense
Salaries 4,061 4,035 3,936 3,851 3,938 3,914 3,795 3,728
Commission and incentive compensation 2,457 2,604 2,606 2,685 2,582 2,527 2,445 2,416
Employee benefits 1,042 821 1,106 1,477 1,124 931 1,170 1,372
Equipment 640 459 470 494 581 457 445 490
Net occupancy 725 728 710 723 730 731 722 742
Core deposit and other intangibles 311 311 312 312 338 342 349 341
FDIC and other deposit assessments 258 245 222 248 231 229 225 243
Other 3,105 3,196 3,107 2,717 3,123 3,117 3,043 2,616
Total noninterest expense 12,599 12,399 12,469 12,507 12,647 12,248 12,194 11,948
Income before income tax expense 8,156 8,773 8,549 8,163 8,311 8,597 8,655 8,352
Income tax expense 2,533 2,790 2,763 2,279 2,519 2,642 2,869 2,277
Net income before noncontrolling interests 5,623 5,983 5,786 5,884 5,792 5,955 5,786 6,075
Less: Net income from noncontrolling interests 48 187 67 80 83 226 60 182
Wells Fargo net income $ 5,575 5,796 5,719 5,804 5,709 5,729 5,726 5,893
Less: Preferred stock dividends and other 372 353 356 343 327 321 302 286
Wells Fargo net income applicable to common
stock 5,203 5,443 5,363 5,461 5,382 5,408 5,424 5,607
Per share information
Earnings per common share $ 1.02 1.06 1.04 1.06 1.04 1.04 1.02 1.07
Diluted earnings per common share 1.00 1.05 1.03 1.04 1.02 1.02 1.01 1.05
Dividends declared per common share 0.38 0.38 0.38 0.35 0.35 0.35 0.35 0.30
Average common shares outstanding 5,108.5 5,125.8 5,151.9 5,160.4 5,192.5 5,225.9 5,268.4 5,262.8
Diluted average common shares outstanding 5,177.9 5,193.8 5,220.5 5,243.6 5,279.2 5,310.4 5,350.8 5,353.3
Market price per common share (1)
High $ 56.34 58.77 58.26 56.29 55.95 53.80 53.05 49.97
Low 49.51 47.75 53.56 50.42 46.44 49.47 46.72 44.17
Quarter-end 54.36 51.35 56.24 54.40 54.82 51.87 52.56 49.74
(1) Based on daily prices reported on the New York Stock Exchange Composite Transaction Reporting System.
Wells Fargo & Company
264