Wells Fargo 2015 Annual Report Download - page 47
Download and view the complete annual report
Please find page 47 of the 2015 Wells Fargo annual report below. You can navigate through the pages in the report by either clicking on the pages listed below, or by using the keyword search tool below to find specific information within the annual report.-
 1
1 -
2
-
3
-
4
-
5
-
6
-
7
-
8
-
9
-
10
-
11
-
12
-
13
-
14
-
15
-
16
-
17
-
18
-
19
-
20
-
21
-
22
-
23
-
24
-
25
-
26
-
27
-
28
-
29
-
30
-
31
-
32
-
33
-
34
-
35
-
36
-
 37
37 -
 38
38 -
 39
39 -
 40
40 -
 41
41 -
 42
42 -
 43
43 -
 44
44 -
 45
45 -
 46
46 -
 47
47 -
 48
48 -
 49
49 -
 50
50 -
 51
51 -
 52
52 -
 53
53 -
 54
54 -
 55
55 -
 56
56 -
 57
57 -
58
-
59
-
60
-
61
-
62
-
63
-
64
-
65
-
66
-
67
-
68
-
69
-
70
-
71
-
72
-
73
-
74
-
75
-
76
-
77
-
78
-
79
-
80
-
81
-
82
-
83
-
84
-
85
-
86
-
87
-
88
-
89
-
90
-
91
-
92
-
93
-
94
-
95
-
96
-
97
-
98
-
99
-
100
-
101
-
102
-
103
-
104
-
105
-
106
-
107
-
108
-
109
-
110
-
111
-
112
-
113
-
114
-
115
-
116
-
117
-
118
-
119
-
120
-
121
-
122
-
123
-
124
-
125
-
126
-
127
-
128
-
129
-
130
-
131
-
132
-
133
-
134
-
135
-
136
-
137
-
138
-
139
-
140
-
141
-
142
-
143
-
144
-
145
-
146
-
147
-
148
-
149
-
150
-
151
-
152
-
153
-
154
-
155
-
156
-
157
-
158
-
159
-
160
-
161
-
162
-
163
-
164
-
165
-
166
-
167
-
168
-
169
-
170
-
171
-
172
-
173
-
174
-
175
-
176
-
177
-
178
-
179
-
180
-
181
-
182
-
183
-
184
-
185
-
186
-
187
-
188
-
189
-
190
-
191
-
192
-
193
-
194
-
195
-
196
-
197
-
198
-
199
-
200
-
201
-
202
-
203
-
204
-
205
-
206
-
207
-
208
-
209
-
210
-
211
-
212
-
213
-
214
-
215
-
216
-
217
-
218
-
219
-
220
-
221
-
222
-
223
-
224
-
225
-
226
-
227
-
228
-
229
-
230
-
231
-
232
-
233
-
234
-
235
-
236
-
237
-
238
-
239
-
240
-
241
-
242
-
243
-
244
-
245
-
246
-
247
-
248
-
249
-
250
-
251
-
252
-
253
-
254
-
255
-
256
-
257
-
258
-
259
-
260
-
261
-
262
-
263
-
264
-
265
-
266
-
267
-
268
-
269
-
270
-
271
-
272
-
273
 |
 |

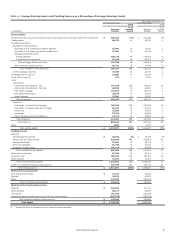
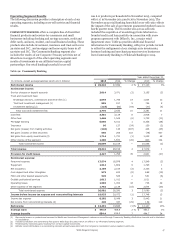
Operating Segment Results
We are organized for management reporting purposes into three
operating segments: Community Banking; Wholesale Banking;
and Wealth and Investment Management (WIM) (formerly
Wealth, Brokerage and Retirement). These segments are defined
by product type and customer segment and their results are
based on our management accounting process, for which there is
no comprehensive, authoritative financial accounting guidance
equivalent to generally accepted accounting principles (GAAP).
During 2015, we realigned our asset management business from
Wholesale Banking to WIM; our reinsurance business from WIM
to Wholesale Banking; and our strategic auto investments,
business banking and merchant payment services businesses
Table 9: Operating Segment Results – Highlights
from Community Banking to Wholesale Banking. These
realignments are part of our regular course of business as we are
always looking for ways to better align our businesses, deepen
existing customer relationships, and create a best-in-class
structure to benefit both our customers and our shareholders.
Results for these operating segments were revised for prior
periods to reflect the impact of these realignments. The following
discussion presents our methodology for measuring cross-sell
for each of our operating segments, and along with Tables 9, 9a,
9b and 9c, present our results by operating segment. For
additional financial information and the underlying
management accounting process, see Note 24 (Operating
Segments) to Financial Statements in this Report.
Year ended December 31,
Wealth and
Community Wholesale Investment Consolidated
(in millions, except average balances which are in billions) Banking Banking Management Other (1) Company
2015
Revenue $ 49,341 25,904 15,777 (4,965) 86,057
Provision (reversal of provision) for credit losses 2,427 27 (25) 13 2,442
Net income (loss) 13,491 8,194 2,316 (1,107) 22,894
Average loans $ 475.9 397.3 60.1 (47.9) 885.4
Average deposits 654.4 438.9 172.3 (71.5) 1,194.1
2014
Revenue $ 48,158 25,398 15,269 (4,478) 84,347
Provision (reversal of provision) for credit losses 1,796 (382) (50) 31 1,395
Net income (loss) 13,686 8,199 2,060 (888) 23,057
Average loans $ 468.8 355.6 52.1 (42.1) 834.4
Average deposits 614.3 404.0 163.5 (67.7) 1,114.1
2013
Revenue $ 47,679 25,847 14,330 (4,076) 83,780
Provision (reversal of provision) for credit losses 2,841 (521) (16) 5 2,309
Net income (loss) 12,147 8,752 1,766 (787) 21,878
Average loans $ 465.1 329.0 46.2 (37.6) 802.7
Average deposits 494.7 353.8 158.9 (65.3) 942.1
(1) Includes items not assigned to a specific business segment and elimination of certain items that are included in more than one business segment, substantially all of which
represents products and services for WIM customers served through Community Banking distribution channels.
Wells Fargo & Company
45