Wells Fargo 2015 Annual Report Download - page 135
Download and view the complete annual report
Please find page 135 of the 2015 Wells Fargo annual report below. You can navigate through the pages in the report by either clicking on the pages listed below, or by using the keyword search tool below to find specific information within the annual report.-
 1
1 -
2
-
3
-
4
-
5
-
6
-
7
-
8
-
9
-
10
-
11
-
12
-
13
-
14
-
15
-
16
-
17
-
18
-
19
-
20
-
21
-
22
-
23
-
24
-
25
-
26
-
27
-
28
-
29
-
30
-
31
-
32
-
33
-
34
-
35
-
36
-
37
-
38
-
39
-
40
-
41
-
42
-
43
-
44
-
45
-
46
-
47
-
48
-
49
-
50
-
51
-
52
-
53
-
54
-
55
-
56
-
57
-
58
-
59
-
60
-
61
-
62
-
63
-
64
-
65
-
66
-
67
-
68
-
69
-
70
-
71
-
72
-
73
-
74
-
75
-
76
-
77
-
78
-
79
-
80
-
81
-
82
-
83
-
84
-
85
-
86
-
87
-
88
-
89
-
90
-
91
-
92
-
93
-
94
-
95
-
96
-
97
-
98
-
99
-
100
-
101
-
102
-
103
-
104
-
105
-
106
-
107
-
108
-
109
-
110
-
111
-
112
-
113
-
114
-
115
-
116
-
117
-
118
-
119
-
120
-
121
-
122
-
123
-
124
-
 125
125 -
 126
126 -
 127
127 -
 128
128 -
 129
129 -
 130
130 -
 131
131 -
 132
132 -
 133
133 -
 134
134 -
 135
135 -
 136
136 -
 137
137 -
 138
138 -
 139
139 -
 140
140 -
 141
141 -
 142
142 -
 143
143 -
 144
144 -
 145
145 -
146
-
147
-
148
-
149
-
150
-
151
-
152
-
153
-
154
-
155
-
156
-
157
-
158
-
159
-
160
-
161
-
162
-
163
-
164
-
165
-
166
-
167
-
168
-
169
-
170
-
171
-
172
-
173
-
174
-
175
-
176
-
177
-
178
-
179
-
180
-
181
-
182
-
183
-
184
-
185
-
186
-
187
-
188
-
189
-
190
-
191
-
192
-
193
-
194
-
195
-
196
-
197
-
198
-
199
-
200
-
201
-
202
-
203
-
204
-
205
-
206
-
207
-
208
-
209
-
210
-
211
-
212
-
213
-
214
-
215
-
216
-
217
-
218
-
219
-
220
-
221
-
222
-
223
-
224
-
225
-
226
-
227
-
228
-
229
-
230
-
231
-
232
-
233
-
234
-
235
-
236
-
237
-
238
-
239
-
240
-
241
-
242
-
243
-
244
-
245
-
246
-
247
-
248
-
249
-
250
-
251
-
252
-
253
-
254
-
255
-
256
-
257
-
258
-
259
-
260
-
261
-
262
-
263
-
264
-
265
-
266
-
267
-
268
-
269
-
270
-
271
-
272
-
273
 |
 |

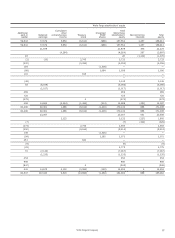
Financial Statements
Wells Fargo & Company and Subsidiaries
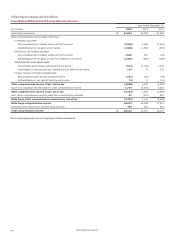
Consolidated Statement of Income
Year ended December 31,
(in millions, except per share amounts) 2015 2014 2013
Interest income
Trading assets $ 1,971 1,685 1,376
Investment securities 8,937 8,438 8,116
Mortgages held for sale 785 767 1,290
Loans held for sale 19 78 13
Loans 36,575 35,652 35,571
Other interest income 990 932 723
Total interest income 49,277 47,552 47,089
Interest expense
Deposits 963 1,096 1,337
Short-term borrowings 64 59 60
Long-term debt 2,592 2,488 2,585
Other interest expense 357 382 307
Total interest expense 3,976 4,025 4,289
Net interest income 45,301 43,527 42,800
Provision for credit losses 2,442 1,395 2,309
Net interest income after provision for credit losses 42,859 42,132 40,491
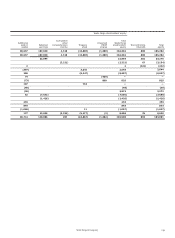
Noninterest income
Service charges on deposit accounts 5,168 5,050 5,023
Trust and investment fees 14,468 14,280 13,430
Card fees 3,720 3,431 3,191
Other fees 4,324 4,349 4,340
Mortgage banking 6,501 6,381 8,774
Insurance 1,694 1,655 1,814
Net gains from trading activities 614 1,161 1,623
Net gains (losses) on debt securities (1) 952 593 (29)
Net gains from equity investments (2) 2,230 2,380 1,472
Lease income 621 526 663
Other 464 1,014 679
Total noninterest income 40,756 40,820 40,980
Noninterest expense
Salaries 15,883 15,375 15,152
Commission and incentive compensation 10,352 9,970 9,951
Employee benefits 4,446 4,597 5,033
Equipment 2,063 1,973 1,984
Net occupancy 2,886 2,925 2,895
Core deposit and other intangibles 1,246 1,370 1,504
FDIC and other deposit assessments 973 928 961
Other 12,125 11,899 11,362
Total noninterest expense 49,974 49,037 48,842
Income before income tax expense 33,641 33,915 32,629
Income tax expense 10,365 10,307 10,405
Net income before noncontrolling interests 23,276 23,608 22,224
Less: Net income from noncontrolling interests 382 551 346
Wells Fargo net income $ 22,894 23,057 21,878
Less: Preferred stock dividends and other 1,424 1,236 989
Wells Fargo net income applicable to common stock $ 21,470 21,821 20,889
Per share information
Earnings per common share $ 4.18 4.17 3.95
Diluted earnings per common share 4.12 4.10 3.89
Dividends declared per common share 1.475 1.350 1.150
Average common shares outstanding 5,136.5 5,237.2 5,287.3
Diluted average common shares outstanding 5,209.8 5,324.4 5,371.2
(1) Total other-than-temporary impairment (OTTI) losses were $136 million, $18 million and $39 million for the years ended December 31, 2015, 2014 and 2013, respectively.
Of total OTTI, losses of $183 million, $49 million and $158 million were recognized in earnings, and reversal of losses of $(47) million, $(31) million and $(119) million
were recognized as non-credit-related OTTI in other comprehensive income for the years ended December 31, 2015, 2014 and 2013, respectively.
(2) Includes OTTI losses of $376 million, $273 million and $186 million for the years ended December 31, 2015, 2014 and 2013, respectively.
The accompanying notes are an integral part of these statements.
Wells Fargo & Company
133