Wells Fargo 2015 Annual Report Download - page 114
Download and view the complete annual report
Please find page 114 of the 2015 Wells Fargo annual report below. You can navigate through the pages in the report by either clicking on the pages listed below, or by using the keyword search tool below to find specific information within the annual report.-
 1
1 -
2
-
3
-
4
-
5
-
6
-
7
-
8
-
9
-
10
-
11
-
12
-
13
-
14
-
15
-
16
-
17
-
18
-
19
-
20
-
21
-
22
-
23
-
24
-
25
-
26
-
27
-
28
-
29
-
30
-
31
-
32
-
33
-
34
-
35
-
36
-
37
-
38
-
39
-
40
-
41
-
42
-
43
-
44
-
45
-
46
-
47
-
48
-
49
-
50
-
51
-
52
-
53
-
54
-
55
-
56
-
57
-
58
-
59
-
60
-
61
-
62
-
63
-
64
-
65
-
66
-
67
-
68
-
69
-
70
-
71
-
72
-
73
-
74
-
75
-
76
-
77
-
78
-
79
-
80
-
81
-
82
-
83
-
84
-
85
-
86
-
87
-
88
-
89
-
90
-
91
-
92
-
93
-
94
-
95
-
96
-
97
-
98
-
99
-
100
-
101
-
102
-
103
-
 104
104 -
 105
105 -
 106
106 -
 107
107 -
 108
108 -
 109
109 -
 110
110 -
 111
111 -
 112
112 -
 113
113 -
 114
114 -
 115
115 -
 116
116 -
 117
117 -
 118
118 -
 119
119 -
 120
120 -
 121
121 -
 122
122 -
 123
123 -
 124
124 -
125
-
126
-
127
-
128
-
129
-
130
-
131
-
132
-
133
-
134
-
135
-
136
-
137
-
138
-
139
-
140
-
141
-
142
-
143
-
144
-
145
-
146
-
147
-
148
-
149
-
150
-
151
-
152
-
153
-
154
-
155
-
156
-
157
-
158
-
159
-
160
-
161
-
162
-
163
-
164
-
165
-
166
-
167
-
168
-
169
-
170
-
171
-
172
-
173
-
174
-
175
-
176
-
177
-
178
-
179
-
180
-
181
-
182
-
183
-
184
-
185
-
186
-
187
-
188
-
189
-
190
-
191
-
192
-
193
-
194
-
195
-
196
-
197
-
198
-
199
-
200
-
201
-
202
-
203
-
204
-
205
-
206
-
207
-
208
-
209
-
210
-
211
-
212
-
213
-
214
-
215
-
216
-
217
-
218
-
219
-
220
-
221
-
222
-
223
-
224
-
225
-
226
-
227
-
228
-
229
-
230
-
231
-
232
-
233
-
234
-
235
-
236
-
237
-
238
-
239
-
240
-
241
-
242
-
243
-
244
-
245
-
246
-
247
-
248
-
249
-
250
-
251
-
252
-
253
-
254
-
255
-
256
-
257
-
258
-
259
-
260
-
261
-
262
-
263
-
264
-
265
-
266
-
267
-
268
-
269
-
270
-
271
-
272
-
273
 |
 |
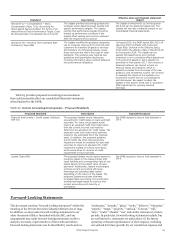
Critical Accounting Policies (continued)
future net servicing income and incorporates inputs and
assumptions that market participants use in estimating fair
value. Certain significant inputs and assumptions are not
observable in the market and require judgment to determine:
• The mortgage loan prepayment speed used to estimate
future net servicing income. The prepayment speed is the
annual rate at which borrowers are forecasted to repay their
mortgage loan principal; this rate also includes estimated
borrower defaults. We use models to estimate prepayment
speeds and borrower defaults which are influenced by
changes in mortgage interest rates and borrower behavior.
• The discount rate used to present value estimated future
net servicing income. The discount rate is the required rate
of return investors in the market would expect for an asset
with similar risk. To determine the discount rate, we
consider the risk premium for uncertainties from servicing
operations (e.g., possible changes in future servicing costs,
ancillary income and earnings on escrow accounts).
• The expected cost to service loans used to estimate future
net servicing income. The cost to service loans includes
estimates for unreimbursed expenses, such as delinquency
and foreclosure costs, which considers the number of
defaulted loans as well as changes in servicing processes
associated with default and foreclosure management.
Both prepayment speed and discount rate assumptions can,
and generally will, change quarterly as market conditions and
mortgage interest rates change. For example, an increase in
either the prepayment speed or discount rate assumption results
in a decrease in the fair value of the MSRs, while a decrease in
either assumption would result in an increase in the fair value of
the MSRs. In recent years, there have been significant market-
driven fluctuations in loan prepayment speeds and the discount
rate. These fluctuations can be rapid and may be significant in
the future. Additionally, while our current valuation reflects our
best estimate of servicing costs, future regulatory changes in
servicing standards, as well as changes in individual state
foreclosure legislation, may have an impact on our servicing cost
assumption and our MSR valuation in future periods.
For a description of our valuation and sensitivity of MSRs,
see Note 1 (Summary of Significant Accounting Policies), Note 8
(Securitizations and Variable Interest Entities), Note 9
(Mortgage Banking Activities) and Note 17 (Fair Values of Assets
and Liabilities) to Financial Statements in this Report.
Fair Value of Financial Instruments
Fair value represents the price that would be received to sell the
financial asset or paid to transfer the financial liability in an
orderly transaction between market participants at the
measurement date.
We use fair value measurements to record fair value
adjustments to certain financial instruments and to determine
fair value disclosures. For example, trading assets, securities
available for sale, derivatives and substantially all of our
residential MHFS are carried at fair value each period. Other
financial instruments, such as certain MHFS and substantially
all of our loans held for investment, are not carried at fair value
each period but may require nonrecurring fair value
adjustments due to application of lower-of-cost-or-market
accounting or write-downs of individual assets. We also disclose
our estimate of fair value for financial instruments not recorded
at fair value, such as loans held for investment or issuances of
long-term debt.
The accounting provisions for fair value measurements
include a three-level hierarchy for disclosure of assets and
liabilities recorded at fair value. The classification of assets and
liabilities within the hierarchy is based on whether the inputs to
the valuation methodology used for measurement are observable
or unobservable. Observable inputs reflect market-derived or
market-based information obtained from independent sources,
while unobservable inputs reflect our estimates about market
data. For additional information on fair value levels, see Note 17
(Fair Values of Assets and Liabilities) to Financial Statements in
this Report.
When developing fair value measurements, we maximize
the use of observable inputs and minimize the use of
unobservable inputs. When available, we use quoted prices in
active markets to measure fair value. If quoted prices in active
markets are not available, fair value measurement is based upon
models that use primarily market-based or independently
sourced market parameters, including interest rate yield curves,
prepayment speeds, option volatilities and currency rates.
However, in certain cases, when market observable inputs for
model-based valuation techniques are not readily available, we
are required to make judgments about assumptions market
participants would use to estimate fair value. Additionally, we
use third party pricing services to obtain fair values, which are
used to either record the price of an instrument or to corroborate
internally developed prices. For additional information on our
use of pricing services, see Note 1 (Summary of Significant
Accounting Policies) and Note 17 (Fair Value of Assets and
Liabilities) to Financial Statements in this Report.
The degree of management judgment involved in
determining the fair value of a financial instrument is dependent
upon the availability of quoted prices in active markets or
observable market parameters. For financial instruments with
quoted market prices or observable market parameters in active
markets, there is minimal subjectivity involved in measuring fair
value. When quoted prices and observable data in active markets
are not fully available, management judgment is necessary to
estimate fair value. Changes in the market conditions, such as
reduced liquidity in the capital markets or changes in secondary
market activities, may reduce the availability and reliability of
quoted prices or observable data used to determine fair value.
When significant adjustments are required to price quotes or
inputs, it may be appropriate to utilize an estimate based
primarily on unobservable inputs. When an active market for a
financial instrument does not exist, the use of management
estimates that incorporate current market participant
expectations of future cash flows, adjusted for an appropriate
risk premium, is acceptable.
Significant judgment is also required to determine whether
certain assets measured at fair value are classified as Level 2 or
Level 3. When making this judgment, we consider available
information, including observable market data, indications of
market liquidity and orderliness, and our understanding of the
valuation techniques and significant inputs used. For securities
in inactive markets, we use a predetermined percentage to
evaluate the impact of fair value adjustments derived from
weighting both external and internal indications of value to
determine if the instrument is classified as Level 2 or Level 3.
Otherwise, the classification of Level 2 or Level 3 is based upon
the specific facts and circumstances of each instrument or
instrument category and judgments are made regarding the
significance of the Level 3 inputs to the instruments’ fair value
measurement in its entirety. If Level 3 inputs are considered
significant, the instrument is classified as Level 3.
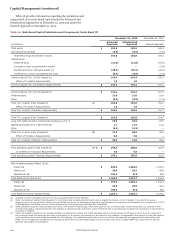
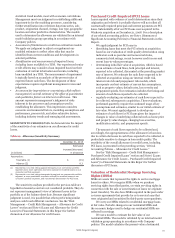
Table 61 presents the summary of the fair value of financial
instruments recorded at fair value on a recurring basis, and the
amounts measured using significant Level 3 inputs (before
Wells Fargo & Company
112