Wells Fargo 2015 Annual Report Download - page 205
Download and view the complete annual report
Please find page 205 of the 2015 Wells Fargo annual report below. You can navigate through the pages in the report by either clicking on the pages listed below, or by using the keyword search tool below to find specific information within the annual report.-
 1
1 -
2
-
3
-
4
-
5
-
6
-
7
-
8
-
9
-
10
-
11
-
12
-
13
-
14
-
15
-
16
-
17
-
18
-
19
-
20
-
21
-
22
-
23
-
24
-
25
-
26
-
27
-
28
-
29
-
30
-
31
-
32
-
33
-
34
-
35
-
36
-
37
-
38
-
39
-
40
-
41
-
42
-
43
-
44
-
45
-
46
-
47
-
48
-
49
-
50
-
51
-
52
-
53
-
54
-
55
-
56
-
57
-
58
-
59
-
60
-
61
-
62
-
63
-
64
-
65
-
66
-
67
-
68
-
69
-
70
-
71
-
72
-
73
-
74
-
75
-
76
-
77
-
78
-
79
-
80
-
81
-
82
-
83
-
84
-
85
-
86
-
87
-
88
-
89
-
90
-
91
-
92
-
93
-
94
-
95
-
96
-
97
-
98
-
99
-
100
-
101
-
102
-
103
-
104
-
105
-
106
-
107
-
108
-
109
-
110
-
111
-
112
-
113
-
114
-
115
-
116
-
117
-
118
-
119
-
120
-
121
-
122
-
123
-
124
-
125
-
126
-
127
-
128
-
129
-
130
-
131
-
132
-
133
-
134
-
135
-
136
-
137
-
138
-
139
-
140
-
141
-
142
-
143
-
144
-
145
-
146
-
147
-
148
-
149
-
150
-
151
-
152
-
153
-
154
-
155
-
156
-
157
-
158
-
159
-
160
-
161
-
162
-
163
-
164
-
165
-
166
-
167
-
168
-
169
-
170
-
171
-
172
-
173
-
174
-
175
-
176
-
177
-
178
-
179
-
180
-
181
-
182
-
183
-
184
-
185
-
186
-
187
-
188
-
189
-
190
-
191
-
192
-
193
-
194
-
 195
195 -
 196
196 -
 197
197 -
 198
198 -
 199
199 -
 200
200 -
 201
201 -
 202
202 -
 203
203 -
 204
204 -
 205
205 -
 206
206 -
 207
207 -
 208
208 -
 209
209 -
 210
210 -
 211
211 -
 212
212 -
 213
213 -
 214
214 -
 215
215 -
216
-
217
-
218
-
219
-
220
-
221
-
222
-
223
-
224
-
225
-
226
-
227
-
228
-
229
-
230
-
231
-
232
-
233
-
234
-
235
-
236
-
237
-
238
-
239
-
240
-
241
-
242
-
243
-
244
-
245
-
246
-
247
-
248
-
249
-
250
-
251
-
252
-
253
-
254
-
255
-
256
-
257
-
258
-
259
-
260
-
261
-
262
-
263
-
264
-
265
-
266
-
267
-
268
-
269
-
270
-
271
-
272
-
273
 |
 |

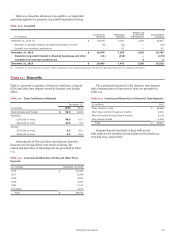
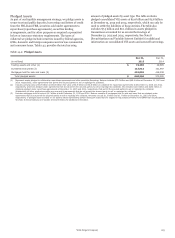
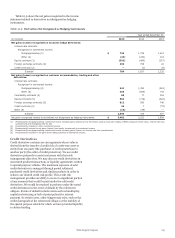
Pledged Assets
As part of our liquidity management strategy, we pledge assets to
secure trust and public deposits, borrowings and letters of credit
from the FHLB and FRB, securities sold under agreements to
repurchase (repurchase agreements), securities lending
arrangements, and for other purposes as required or permitted
by law or insurance statutory requirements. The types of
collateral we pledge include securities issued by federal agencies,
GSEs, domestic and foreign companies and various commercial
and consumer loans. Table 14.2 provides the total carrying
Table 14.2: Pledged Assets
amount of pledged assets by asset type. The table excludes
pledged consolidated VIE assets of $5.6 billion and $5.8 billion
at December 31, 2015 and 2014, respectively, which can only be
used to settle the liabilities of those entities. The table also
excludes $7.3 billion and $10.1 billion in assets pledged in
transactions accounted for as secured borrowings at
December 31, 2015 and 2014, respectively. See Note 8
(Securitizations and Variable Interest Entities) for additional
information on consolidated VIE assets and secured borrowings.
Dec 31, Dec 31,
(in millions) 2015 2014
Trading assets and other (1) $ 73,396 49,685
Investment securities (2) 113,912 101,997
Mortgages held for sale and loans (3) 453,058 418,338
Total pledged assets $ 640,366 570,020
(1) Represent assets pledged to collateralize repurchase agreements and other securities financings. Balance includes $73.0 billion and $49.4 billion at December 31, 2015 and
2014, respectively, under agreements that permit the secured parties to sell or repledge the collateral.
(2) Includes carrying value of $6.5 billion and $6.6 billion (fair value of $6.5 billion and $6.8 billion) in collateral for repurchase agreements at December 31, 2015 and 2014,
respectively, which are pledged under agreements that do not permit the secured parties to sell or repledge the collateral. Also includes $13.0 billion and $164 million in
collateral pledged under repurchase agreements at December 31, 2015 and 2014, respectively, that permit the secured parties to sell or repledge the collateral.
Substantially all other pledged securities are pursuant to agreements that do not permit the secured party to sell or repledge the collateral.
(3) Includes mortgages held for sale of $8.7 billion at both December 31, 2015 and 2014. Balance consists of mortgages held for sale and loans that are pledged under
agreements that do not permit the secured parties to sell or repledge the collateral. Amounts exclude $1.3 billion and $1.7 billion at December 31, 2015 and 2014,
respectively, of pledged loans recorded on our balance sheet representing certain delinquent loans that are eligible for repurchase primarily from GNMA loan securitizations.
See Note 8 (Securitizations and Variable Interest Entities) for additional information.
Wells Fargo & Company
203