Wells Fargo 2015 Annual Report Download - page 195
Download and view the complete annual report
Please find page 195 of the 2015 Wells Fargo annual report below. You can navigate through the pages in the report by either clicking on the pages listed below, or by using the keyword search tool below to find specific information within the annual report.-
 1
1 -
 2
2 -
 3
3 -
 4
4 -
 5
5 -
 6
6 -
 7
7 -
 8
8 -
 9
9 -
 10
10 -
 11
11 -
 12
12 -
 13
13 -
 14
14 -
 15
15 -
 16
16 -
 17
17 -
 18
18 -
 19
19 -
 20
20 -
 21
21 -
 22
22 -
 23
23 -
 24
24 -
 25
25 -
 26
26 -
 27
27 -
 28
28 -
 29
29 -
 30
30 -
 31
31 -
 32
32 -
 33
33 -
 34
34 -
 35
35 -
 36
36 -
 37
37 -
 38
38 -
 39
39 -
 40
40 -
 41
41 -
 42
42 -
 43
43 -
 44
44 -
 45
45 -
 46
46 -
 47
47 -
 48
48 -
 49
49 -
 50
50 -
 51
51 -
 52
52 -
 53
53 -
 54
54 -
 55
55 -
 56
56 -
 57
57 -
 58
58 -
 59
59 -
 60
60 -
 61
61 -
 62
62 -
 63
63 -
 64
64 -
 65
65 -
 66
66 -
 67
67 -
 68
68 -
 69
69 -
 70
70 -
 71
71 -
 72
72 -
 73
73 -
 74
74 -
 75
75 -
 76
76 -
 77
77 -
 78
78 -
 79
79 -
 80
80 -
 81
81 -
 82
82 -
 83
83 -
 84
84 -
 85
85 -
 86
86 -
 87
87 -
 88
88 -
 89
89 -
 90
90 -
 91
91 -
 92
92 -
 93
93 -
 94
94 -
 95
95 -
 96
96 -
 97
97 -
 98
98 -
 99
99 -
 100
100 -
 101
101 -
 102
102 -
 103
103 -
 104
104 -
 105
105 -
 106
106 -
 107
107 -
 108
108 -
 109
109 -
 110
110 -
 111
111 -
 112
112 -
 113
113 -
 114
114 -
 115
115 -
 116
116 -
 117
117 -
 118
118 -
 119
119 -
 120
120 -
 121
121 -
 122
122 -
 123
123 -
 124
124 -
 125
125 -
 126
126 -
 127
127 -
 128
128 -
 129
129 -
 130
130 -
 131
131 -
 132
132 -
 133
133 -
 134
134 -
 135
135 -
 136
136 -
 137
137 -
 138
138 -
 139
139 -
 140
140 -
 141
141 -
 142
142 -
 143
143 -
 144
144 -
 145
145 -
 146
146 -
 147
147 -
 148
148 -
 149
149 -
 150
150 -
 151
151 -
 152
152 -
 153
153 -
 154
154 -
 155
155 -
 156
156 -
 157
157 -
 158
158 -
 159
159 -
 160
160 -
 161
161 -
 162
162 -
 163
163 -
 164
164 -
 165
165 -
 166
166 -
 167
167 -
 168
168 -
 169
169 -
 170
170 -
 171
171 -
 172
172 -
 173
173 -
 174
174 -
 175
175 -
 176
176 -
 177
177 -
 178
178 -
 179
179 -
 180
180 -
 181
181 -
 182
182 -
 183
183 -
 184
184 -
 185
185 -
 186
186 -
 187
187 -
 188
188 -
 189
189 -
 190
190 -
 191
191 -
 192
192 -
 193
193 -
 194
194 -
 195
195 -
 196
196 -
 197
197 -
 198
198 -
 199
199 -
 200
200 -
 201
201 -
 202
202 -
 203
203 -
 204
204 -
 205
205 -
 206
206 -
 207
207 -
 208
208 -
 209
209 -
 210
210 -
 211
211 -
 212
212 -
 213
213 -
 214
214 -
 215
215 -
 216
216 -
 217
217 -
 218
218 -
 219
219 -
 220
220 -
 221
221 -
 222
222 -
 223
223 -
 224
224 -
 225
225 -
 226
226 -
 227
227 -
 228
228 -
 229
229 -
 230
230 -
 231
231 -
 232
232 -
 233
233 -
 234
234 -
 235
235 -
 236
236 -
 237
237 -
 238
238 -
 239
239 -
 240
240 -
 241
241 -
 242
242 -
 243
243 -
 244
244 -
 245
245 -
 246
246 -
 247
247 -
 248
248 -
 249
249 -
 250
250 -
 251
251 -
 252
252 -
 253
253 -
 254
254 -
 255
255 -
 256
256 -
 257
257 -
 258
258 -
 259
259 -
 260
260 -
 261
261 -
 262
262 -
 263
263 -
 264
264 -
 265
265 -
 266
266 -
 267
267 -
 268
268 -
 269
269 -
 270
270 -
 271
271 -
 272
272 -
 273
273
 |
 |

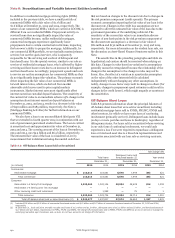
Note 9: Mortgage Banking Activities
Mortgage banking activities, included in the Community We apply the amortization method to commercial MSRs and
Banking and Wholesale Banking operating segments, consist of apply the fair value method to residential MSRs. Table 9.1
residential and commercial mortgage originations, sale activity presents the changes in MSRs measured using the fair value
and servicing. method.
Table 9.1: Analysis of Changes in Fair Value MSRs
Year ended December 31,
(in millions) 2015 2014 2013
Fair value, beginning of year $ 12,738 15,580 11,538
Servicing from securitizations or asset transfers 1,556 1,196 3,469
Sales and other (1) (9) (7) (583)
Net additions 1,547 1,189 2,886
Changes in fair value:
Due to changes in valuation model inputs or assumptions:
Mortgage interest rates (2) 247 (2,150) 4,362
Servicing and foreclosure costs (3) (83) (20) (228)
Discount rates (4) — (55) —
Prepayment estimates and other (5) 50 103 (736)
Net changes in valuation model inputs or assumptions 214 (2,122) 3,398
Other changes in fair value (6) (2,084) (1,909) (2,242)
Total changes in fair value (1,870) (4,031) 1,156
Fair value, end of year $ 12,415 12,738 15,580
(1) Includes sales and transfers of MSRs, which can result in an increase of total reported MSRs if the sales or transfers are related to nonperforming loan portfolios.
(2) Includes prepayment speed changes as well as other valuation changes due to changes in mortgage interest rates (such as changes in estimated interest earned on
custodial deposit balances).
(3) Includes costs to service and unreimbursed foreclosure costs.
(4) Reflects discount rate assumption change, excluding portion attributable to changes in mortgage interest rates.
(5) Represents changes driven by other valuation model inputs or assumptions including prepayment speed estimation changes and other assumption updates. Prepayment
speed estimation changes are influenced by observed changes in borrower behavior and other external factors that occur independent of interest rate changes.
(6) Represents changes due to collection/realization of expected cash flows over time.
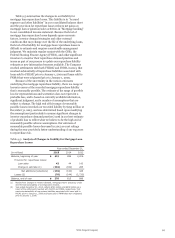
Table 9.2 presents the changes in amortized MSRs.
Table 9.2: Analysis of Changes in Amortized MSRs
Year ended December 31,
(in millions) 2015 2014 2013
Balance, beginning of year $ 1,242 1,229 1,160
Purchases 144 157 176
Servicing from securitizations or asset transfers 180 110 147
Amortization (258) (254) (254)
Balance, end of year (1) $ 1,308 1,242 1,229
Fair value of amortized MSRs:
Beginning of year $ 1,637 1,575 1,400
End of year 1,680 1,637 1,575
(1) Commercial amortized MSRs are evaluated for impairment purposes by the following risk strata: agency (GSEs) and non-agency. There was no valuation allowance
recorded for the periods presented on the commercial amortized MSRs.
Wells Fargo & Company
193
