Wells Fargo 2015 Annual Report Download - page 37
Download and view the complete annual report
Please find page 37 of the 2015 Wells Fargo annual report below. You can navigate through the pages in the report by either clicking on the pages listed below, or by using the keyword search tool below to find specific information within the annual report.-
 1
1 -
2
-
3
-
4
-
5
-
6
-
7
-
8
-
9
-
10
-
11
-
12
-
13
-
14
-
15
-
16
-
17
-
18
-
19
-
20
-
21
-
22
-
23
-
24
-
25
-
26
-
 27
27 -
 28
28 -
 29
29 -
 30
30 -
 31
31 -
 32
32 -
 33
33 -
 34
34 -
 35
35 -
 36
36 -
 37
37 -
 38
38 -
 39
39 -
 40
40 -
 41
41 -
 42
42 -
 43
43 -
 44
44 -
 45
45 -
 46
46 -
 47
47 -
48
-
49
-
50
-
51
-
52
-
53
-
54
-
55
-
56
-
57
-
58
-
59
-
60
-
61
-
62
-
63
-
64
-
65
-
66
-
67
-
68
-
69
-
70
-
71
-
72
-
73
-
74
-
75
-
76
-
77
-
78
-
79
-
80
-
81
-
82
-
83
-
84
-
85
-
86
-
87
-
88
-
89
-
90
-
91
-
92
-
93
-
94
-
95
-
96
-
97
-
98
-
99
-
100
-
101
-
102
-
103
-
104
-
105
-
106
-
107
-
108
-
109
-
110
-
111
-
112
-
113
-
114
-
115
-
116
-
117
-
118
-
119
-
120
-
121
-
122
-
123
-
124
-
125
-
126
-
127
-
128
-
129
-
130
-
131
-
132
-
133
-
134
-
135
-
136
-
137
-
138
-
139
-
140
-
141
-
142
-
143
-
144
-
145
-
146
-
147
-
148
-
149
-
150
-
151
-
152
-
153
-
154
-
155
-
156
-
157
-
158
-
159
-
160
-
161
-
162
-
163
-
164
-
165
-
166
-
167
-
168
-
169
-
170
-
171
-
172
-
173
-
174
-
175
-
176
-
177
-
178
-
179
-
180
-
181
-
182
-
183
-
184
-
185
-
186
-
187
-
188
-
189
-
190
-
191
-
192
-
193
-
194
-
195
-
196
-
197
-
198
-
199
-
200
-
201
-
202
-
203
-
204
-
205
-
206
-
207
-
208
-
209
-
210
-
211
-
212
-
213
-
214
-
215
-
216
-
217
-
218
-
219
-
220
-
221
-
222
-
223
-
224
-
225
-
226
-
227
-
228
-
229
-
230
-
231
-
232
-
233
-
234
-
235
-
236
-
237
-
238
-
239
-
240
-
241
-
242
-
243
-
244
-
245
-
246
-
247
-
248
-
249
-
250
-
251
-
252
-
253
-
254
-
255
-
256
-
257
-
258
-
259
-
260
-
261
-
262
-
263
-
264
-
265
-
266
-
267
-
268
-
269
-
270
-
271
-
272
-
273
 |
 |

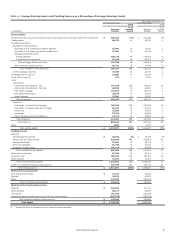
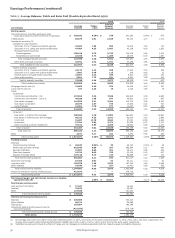
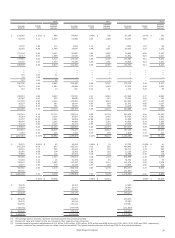
Table 3: Net Interest Income, Noninterest Income and Noninterest Expense as a Percentage of Revenue
Year ended December 31,
% of % of % of
(in millions) 2015 revenue 2014 revenue 2013 revenue
Interest income (on a taxable equivalent basis)
Trading assets $ 2,010 2% $ 1,712 2% $ 1,406 2%
Investment securities 9,906 12 9,253 11 8,841 11
Mortgages held for sale (MHFS) 785 1 767 1 1,290 2
Loans held for sale (LHFS) 19 — 78 — 13 —
Loans 36,663 43 35,715 42 35,618 43
Other interest income 990 1 932 1 724 1
Total interest income (on a taxable equivalent basis) 50,373 59 48,457 57 47,892 57
Interest expense
Deposits 963 1 1,096 1 1,337 2
Short-term borrowings 64 — 62 — 71 —
Long-term debt 2,592 4 2,488 3 2,585 3
Other interest expense 357 — 382 — 307 —
Total interest expense 3,976 5 4,028 4 4,300 5
Net interest income (on a taxable-equivalent basis) 46,397 54 44,429 53 43,592 52
Taxable-equivalent adjustment (1,096) (1) (902) (1) (792) (1)
Net interest income (A) 45,301 53 43,527 52 42,800 51
Noninterest income
Service charges on deposit accounts 5,168 6 5,050 6 5,023 6
Trust and investment fees (1) 14,468 16 14,280 17 13,430 16
Card fees 3,720 4 3,431 4 3,191 4
Other fees (1) 4,324 5 4,349 5 4,340 5
Mortgage banking (1) 6,501 7 6,381 8 8,774 10
Insurance 1,694 2 1,655 2 1,814 2
Net gains from trading activities 614 1 1,161 1 1,623 2
Net gains (losses) on debt securities 952 1 593 1 (29) —
Net gains from equity investments 2,230 3 2,380 3 1,472 2
Lease income 621 1 526 1 663 1
Other 464 1 1,014 1 679 1
Total noninterest income (B) 40,756 47 40,820 48 40,980 49
Noninterest expense
Salaries 15,883 19 15,375 18 15,152 18
Commission and incentive compensation 10,352 12 9,970 12 9,951 12
Employee benefits 4,446 5 4,597 5 5,033 6
Equipment 2,063 2 1,973 2 1,984 2
Net occupancy 2,886 3 2,925 3 2,895 3
Core deposit and other intangibles 1,246 1 1,370 2 1,504 2
FDIC and other deposit assessments 973 1 928 1 961 1
Other (2) 12,125 15 11,899 14 11,362 14
Total noninterest expense 49,974 58 49,037 58 48,842 58
Revenue (A) + (B) $ 86,057 $ 84,347 $ 83,780
(1) See Table 7 – Noninterest Income in this Report for additional detail.
(2) See Table 8 – Noninterest Expense in this Report for additional detail.
Wells Fargo & Company
35