Wells Fargo 2015 Annual Report Download - page 87
Download and view the complete annual report
Please find page 87 of the 2015 Wells Fargo annual report below. You can navigate through the pages in the report by either clicking on the pages listed below, or by using the keyword search tool below to find specific information within the annual report.-
 1
1 -
2
-
3
-
4
-
5
-
6
-
7
-
8
-
9
-
10
-
11
-
12
-
13
-
14
-
15
-
16
-
17
-
18
-
19
-
20
-
21
-
22
-
23
-
24
-
25
-
26
-
27
-
28
-
29
-
30
-
31
-
32
-
33
-
34
-
35
-
36
-
37
-
38
-
39
-
40
-
41
-
42
-
43
-
44
-
45
-
46
-
47
-
48
-
49
-
50
-
51
-
52
-
53
-
54
-
55
-
56
-
57
-
58
-
59
-
60
-
61
-
62
-
63
-
64
-
65
-
66
-
67
-
68
-
69
-
70
-
71
-
72
-
73
-
74
-
75
-
76
-
 77
77 -
 78
78 -
 79
79 -
 80
80 -
 81
81 -
 82
82 -
 83
83 -
 84
84 -
 85
85 -
 86
86 -
 87
87 -
 88
88 -
 89
89 -
 90
90 -
 91
91 -
 92
92 -
 93
93 -
 94
94 -
 95
95 -
 96
96 -
 97
97 -
98
-
99
-
100
-
101
-
102
-
103
-
104
-
105
-
106
-
107
-
108
-
109
-
110
-
111
-
112
-
113
-
114
-
115
-
116
-
117
-
118
-
119
-
120
-
121
-
122
-
123
-
124
-
125
-
126
-
127
-
128
-
129
-
130
-
131
-
132
-
133
-
134
-
135
-
136
-
137
-
138
-
139
-
140
-
141
-
142
-
143
-
144
-
145
-
146
-
147
-
148
-
149
-
150
-
151
-
152
-
153
-
154
-
155
-
156
-
157
-
158
-
159
-
160
-
161
-
162
-
163
-
164
-
165
-
166
-
167
-
168
-
169
-
170
-
171
-
172
-
173
-
174
-
175
-
176
-
177
-
178
-
179
-
180
-
181
-
182
-
183
-
184
-
185
-
186
-
187
-
188
-
189
-
190
-
191
-
192
-
193
-
194
-
195
-
196
-
197
-
198
-
199
-
200
-
201
-
202
-
203
-
204
-
205
-
206
-
207
-
208
-
209
-
210
-
211
-
212
-
213
-
214
-
215
-
216
-
217
-
218
-
219
-
220
-
221
-
222
-
223
-
224
-
225
-
226
-
227
-
228
-
229
-
230
-
231
-
232
-
233
-
234
-
235
-
236
-
237
-
238
-
239
-
240
-
241
-
242
-
243
-
244
-
245
-
246
-
247
-
248
-
249
-
250
-
251
-
252
-
253
-
254
-
255
-
256
-
257
-
258
-
259
-
260
-
261
-
262
-
263
-
264
-
265
-
266
-
267
-
268
-
269
-
270
-
271
-
272
-
273
 |
 |
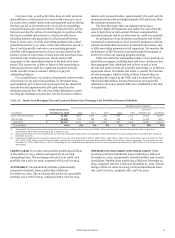
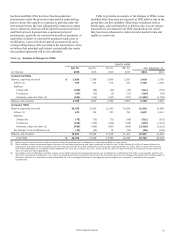
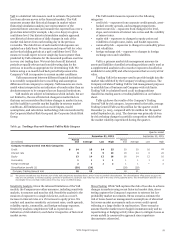
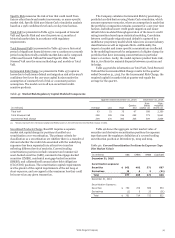
In addition to the allowance for credit losses, there was
$1.9 billion at December 31, 2015, and $2.9 billion at
December 31, 2014, of nonaccretable difference to absorb losses
for PCI loans. The allowance for credit losses is lower than
otherwise would have been required without PCI loan
accounting. As a result of PCI loans, certain ratios of the
Company may not be directly comparable with credit-related
metrics for other financial institutions. Additionally, loans
purchased at fair value generally reflect a lifetime credit loss
adjustment and therefore do not initially require additions to the
allowance as is typically associated with loan growth. For
additional information on PCI loans, see the “Risk Management
– Credit Risk Management – Purchased Credit-Impaired Loans”
section, Note 1 (Summary of Significant Accounting Policies) and
Note 6 (Loans and Allowance for Credit Losses) to Financial
Statements in this Report.
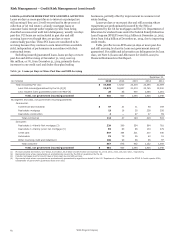
The ratio of the allowance for credit losses to total
nonaccrual loans may fluctuate significantly from period to
period due to such factors as the mix of loan types in the
portfolio, borrower credit strength and the value and
marketability of collateral. Over one-half of our nonaccrual loans
were real estate 1-4 family first and junior lien mortgage loans at
December 31, 2015.
The allowance for credit losses declined in 2015, which
reflected continued credit improvement, particularly in our
residential real estate portfolios and primarily associated with
continued improvement in the housing market, partially offset
by an increase in our commercial allowance to reflect
deterioration in the oil and gas portfolio. The total provision for
credit losses was $2.4 billion in 2015, $1.4 billion in 2014 and
$2.3 billion in 2013. The 2015 provision for credit losses was
$450 million less than net charge-offs, due to strong underlying
credit, and improvement in the housing market. The 2014
provision was $1.6 billion less than net charge-offs, and the 2013
provision was $2.2 billion less than net charge-offs. For each of
2014 and 2013, the provision was influenced by continually
improving credit performance.
We believe the allowance for credit losses of $12.5 billion at
December 31, 2015, was appropriate to cover credit losses
inherent in the loan portfolio, including unfunded credit
commitments, at that date. Approximately $1.2 billion of the
allowance at December 31, 2015 was allocated to our oil and gas
portfolio, however the entire allowance is available to absorb
credit losses inherent in the total loan portfolio. The allowance
for credit losses is subject to change and reflects existing factors
as of the date of determination, including economic or market
conditions and ongoing internal and external examination
processes. Due to the sensitivity of the allowance for credit losses
to changes in the economic and business environment, it is
possible that we will incur incremental credit losses not
anticipated as of the balance sheet date. Future allowance levels
may increase or decrease based on a variety of factors, including
loan growth, portfolio performance and general economic
conditions. Our process for determining the allowance for credit
losses is discussed in the “Critical Accounting Policies –
Allowance for Credit Losses” section and Note 1 (Summary of
Significant Accounting Policies) to Financial Statements in this
Report.
Wells Fargo & Company
85