Wells Fargo 2015 Annual Report Download - page 65
Download and view the complete annual report
Please find page 65 of the 2015 Wells Fargo annual report below. You can navigate through the pages in the report by either clicking on the pages listed below, or by using the keyword search tool below to find specific information within the annual report.-
 1
1 -
2
-
3
-
4
-
5
-
6
-
7
-
8
-
9
-
10
-
11
-
12
-
13
-
14
-
15
-
16
-
17
-
18
-
19
-
20
-
21
-
22
-
23
-
24
-
25
-
26
-
27
-
28
-
29
-
30
-
31
-
32
-
33
-
34
-
35
-
36
-
37
-
38
-
39
-
40
-
41
-
42
-
43
-
44
-
45
-
46
-
47
-
48
-
49
-
50
-
51
-
52
-
53
-
54
-
 55
55 -
 56
56 -
 57
57 -
 58
58 -
 59
59 -
 60
60 -
 61
61 -
 62
62 -
 63
63 -
 64
64 -
 65
65 -
 66
66 -
 67
67 -
 68
68 -
 69
69 -
 70
70 -
 71
71 -
 72
72 -
 73
73 -
 74
74 -
 75
75 -
76
-
77
-
78
-
79
-
80
-
81
-
82
-
83
-
84
-
85
-
86
-
87
-
88
-
89
-
90
-
91
-
92
-
93
-
94
-
95
-
96
-
97
-
98
-
99
-
100
-
101
-
102
-
103
-
104
-
105
-
106
-
107
-
108
-
109
-
110
-
111
-
112
-
113
-
114
-
115
-
116
-
117
-
118
-
119
-
120
-
121
-
122
-
123
-
124
-
125
-
126
-
127
-
128
-
129
-
130
-
131
-
132
-
133
-
134
-
135
-
136
-
137
-
138
-
139
-
140
-
141
-
142
-
143
-
144
-
145
-
146
-
147
-
148
-
149
-
150
-
151
-
152
-
153
-
154
-
155
-
156
-
157
-
158
-
159
-
160
-
161
-
162
-
163
-
164
-
165
-
166
-
167
-
168
-
169
-
170
-
171
-
172
-
173
-
174
-
175
-
176
-
177
-
178
-
179
-
180
-
181
-
182
-
183
-
184
-
185
-
186
-
187
-
188
-
189
-
190
-
191
-
192
-
193
-
194
-
195
-
196
-
197
-
198
-
199
-
200
-
201
-
202
-
203
-
204
-
205
-
206
-
207
-
208
-
209
-
210
-
211
-
212
-
213
-
214
-
215
-
216
-
217
-
218
-
219
-
220
-
221
-
222
-
223
-
224
-
225
-
226
-
227
-
228
-
229
-
230
-
231
-
232
-
233
-
234
-
235
-
236
-
237
-
238
-
239
-
240
-
241
-
242
-
243
-
244
-
245
-
246
-
247
-
248
-
249
-
250
-
251
-
252
-
253
-
254
-
255
-
256
-
257
-
258
-
259
-
260
-
261
-
262
-
263
-
264
-
265
-
266
-
267
-
268
-
269
-
270
-
271
-
272
-
273
 |
 |

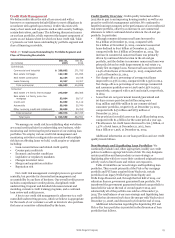
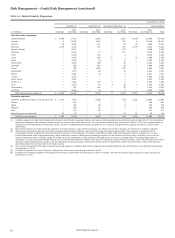
Credit Risk Management
We define credit risk as the risk of loss associated with a
borrower or counterparty default (failure to meet obligations in
accordance with agreed upon terms). Credit risk exists with
many of our assets and exposures such as debt security holdings,
certain derivatives, and loans. The following discussion focuses
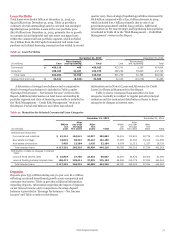
on our loan portfolios, which represent the largest component of
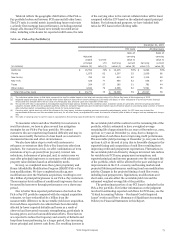
assets on our balance sheet for which we have credit risk. Table
17 presents our total loans outstanding by portfolio segment and
class of financing receivable.
Table 17: Total Loans Outstanding by Portfolio Segment and
Class of Financing Receivable
(in millions)
Dec 31,
2015
Dec 31,
2014
Commercial:
Commercial and industrial $ 299,892 271,795
Real estate mortgage 122,160 111,996
Real estate construction 22,164 18,728
Lease financing 12,367 12,307
Total commercial 456,583 414,826
Consumer:
Real estate 1-4 family first mortgage 273,869 265,386
Real estate 1-4 family junior lien
mortgage 53,004 59,717
Credit card 34,039 31,119
Automobile 59,966 55,740
Other revolving credit and installment 39,098 35,763
Total consumer 459,976 447,725
Total loans $ 916,559 862,551
We manage our credit risk by establishing what we believe
are sound credit policies for underwriting new business, while
monitoring and reviewing the performance of our existing loan
portfolios. We employ various credit risk management and
monitoring activities to mitigate risks associated with multiple
risk factors affecting loans we hold, could acquire or originate
including:
• Loan concentrations and related credit quality
• Counterparty credit risk
• Economic and market conditions
• Legislative or regulatory mandates
• Changes in interest rates
• Merger and acquisition activities
• Reputation risk
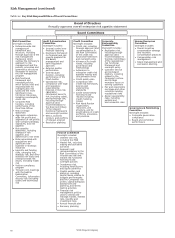
Our credit risk management oversight process is governed
centrally, but provides for decentralized management and
accountability by our lines of business. Our overall credit process
includes comprehensive credit policies, disciplined credit
underwriting, frequent and detailed risk measurement and
modeling, extensive credit training programs, and a continual
loan review and audit process.
A key to our credit risk management is adherence to a well-
controlled underwriting process, which we believe is appropriate
for the needs of our customers as well as investors who purchase
the loans or securities collateralized by the loans.
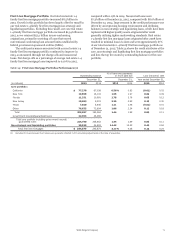
Credit Quality Overview Credit quality remained solid in
2015 due in part to an improving housing market, as well as our
proactive credit risk management activities. We continued to
benefit from improvements in the performance of our residential
real estate portfolio, offset by an increase in our commercial
allowance to reflect continued deterioration in the oil and gas
portfolio. In particular:
• Although commercial nonaccrual loans increased to
$2.4 billion at December 31, 2015, compared with
$2.2 billion at December 31, 2014, consumer nonaccrual
loans declined to $9.0 billion at December 31, 2015,
compared with $10.6 billion at December 31, 2014. The
increase in commercial nonaccrual loans was primarily
driven by continued deterioration in the oil and gas
portfolio, and the decline in consumer nonaccrual loans was
primarily driven by credit improvement in real estate 1-4
family first mortgage loans. Nonaccrual loans represented
1.24% of total loans at December 31, 2015, compared with
1.49% at December 31, 2014.
• Net charge-offs as a percentage of average total loans
improved to 0.33% in 2015, compared with 0.35% in 2014.
Net charge-offs as a percentage of our average commercial
and consumer portfolios were 0.09% and 0.55% in 2015,
respectively, compared with 0.01% and 0.65%, respectively,
in 2014.
• Loans that are not government insured/guaranteed and
90 days or more past due and still accruing were
$114 million and $867 million in our commercial and
consumer portfolios, respectively, at December 31, 2015,
compared with $47 million and $873 million at
December 31, 2014.
• Our provision for credit losses was $2.4 billion during 2015,
compared with $1.4 billion for the same period a year ago.
• The allowance for credit losses decreased to $12.5 billion, or
1.37% of total loans, at December 31, 2015, from
$13.2 billion or 1.53%, at December 31, 2014.
Additional information on our loan portfolios and our credit
quality trends follows.
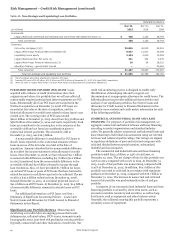
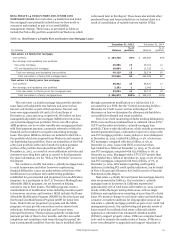
Non-Strategic and Liquidating Loan Portfolios We
continually evaluate and, when appropriate, modify our credit
policies to address appropriate levels of risk. We may designate
certain portfolios and loan products as non-strategic or
liquidating after which we cease their continued origination and
actively work to limit losses and reduce our exposures.
Table 18 identifies our non-strategic and liquidating loan
portfolios. They consist primarily of the Pick-a-Pay mortgage
portfolio and PCI loans acquired from Wachovia, certain
portfolios from legacy Wells Fargo Home Equity and
Wells Fargo Financial, and, through the first half of 2014, our
education finance government guaranteed loan portfolio. We
transferred the government guaranteed student loan portfolio to
loans held for sale at the end of second quarter 2014, and
substantially all of the portfolio was sold as of December 31,
2014. The total balance of our non-strategic and liquidating loan
portfolios has decreased 73% since the merger with Wachovia at
December 31, 2008, and decreased 15% from the end of 2014.
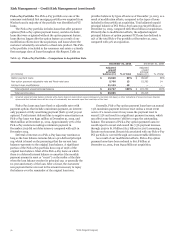
Additional information regarding the liquidating PCI and
Pick-a-Pay loan portfolios is provided in the discussion of loan
portfolios that follows.
Wells Fargo & Company
63