Wells Fargo 2015 Annual Report Download - page 52
Download and view the complete annual report
Please find page 52 of the 2015 Wells Fargo annual report below. You can navigate through the pages in the report by either clicking on the pages listed below, or by using the keyword search tool below to find specific information within the annual report.-
 1
1 -
2
-
3
-
4
-
5
-
6
-
7
-
8
-
9
-
10
-
11
-
12
-
13
-
14
-
15
-
16
-
17
-
18
-
19
-
20
-
21
-
22
-
23
-
24
-
25
-
26
-
27
-
28
-
29
-
30
-
31
-
32
-
33
-
34
-
35
-
36
-
37
-
38
-
39
-
40
-
41
-
 42
42 -
 43
43 -
 44
44 -
 45
45 -
 46
46 -
 47
47 -
 48
48 -
 49
49 -
 50
50 -
 51
51 -
 52
52 -
 53
53 -
 54
54 -
 55
55 -
 56
56 -
 57
57 -
 58
58 -
 59
59 -
 60
60 -
 61
61 -
 62
62 -
63
-
64
-
65
-
66
-
67
-
68
-
69
-
70
-
71
-
72
-
73
-
74
-
75
-
76
-
77
-
78
-
79
-
80
-
81
-
82
-
83
-
84
-
85
-
86
-
87
-
88
-
89
-
90
-
91
-
92
-
93
-
94
-
95
-
96
-
97
-
98
-
99
-
100
-
101
-
102
-
103
-
104
-
105
-
106
-
107
-
108
-
109
-
110
-
111
-
112
-
113
-
114
-
115
-
116
-
117
-
118
-
119
-
120
-
121
-
122
-
123
-
124
-
125
-
126
-
127
-
128
-
129
-
130
-
131
-
132
-
133
-
134
-
135
-
136
-
137
-
138
-
139
-
140
-
141
-
142
-
143
-
144
-
145
-
146
-
147
-
148
-
149
-
150
-
151
-
152
-
153
-
154
-
155
-
156
-
157
-
158
-
159
-
160
-
161
-
162
-
163
-
164
-
165
-
166
-
167
-
168
-
169
-
170
-
171
-
172
-
173
-
174
-
175
-
176
-
177
-
178
-
179
-
180
-
181
-
182
-
183
-
184
-
185
-
186
-
187
-
188
-
189
-
190
-
191
-
192
-
193
-
194
-
195
-
196
-
197
-
198
-
199
-
200
-
201
-
202
-
203
-
204
-
205
-
206
-
207
-
208
-
209
-
210
-
211
-
212
-
213
-
214
-
215
-
216
-
217
-
218
-
219
-
220
-
221
-
222
-
223
-
224
-
225
-
226
-
227
-
228
-
229
-
230
-
231
-
232
-
233
-
234
-
235
-
236
-
237
-
238
-
239
-
240
-
241
-
242
-
243
-
244
-
245
-
246
-
247
-
248
-
249
-
250
-
251
-
252
-
253
-
254
-
255
-
256
-
257
-
258
-
259
-
260
-
261
-
262
-
263
-
264
-
265
-
266
-
267
-
268
-
269
-
270
-
271
-
272
-
273
 |
 |

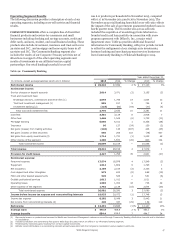
Earnings Performance (continued)
accommodation-related gains on trading assets and lower gains
on equity investments. Noninterest income of $11.3 billion in
2014 decreased $169 million, or 1%, from 2013 as business
growth in commercial real estate brokerage, corporate banking,
equipment finance, international, principal investing and
treasury management was more than offset by lower customer
accommodation related gains on trading assets, lower insurance
income related to a decline in crop insurance fee income, the
2014 divestiture of 40 insurance offices, and lower other income.
Noninterest expense in 2015 increased $285 million, or 2%,
compared with 2014, which was up 6%, or $754 million, from
2013. The increase in both 2015 and 2014 was due to higher
personnel and non-personnel expenses related to growth
initiatives and compliance and regulatory requirements as well
as increased operating losses. The provision for credit losses
increased $409 million from 2014 due primarily to increased
losses in the oil and gas portfolio as well as lower recoveries. The
provision for credit losses increased $139 million from 2013 due
primarily to strong commercial loan growth in 2014.
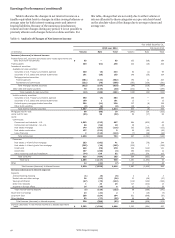
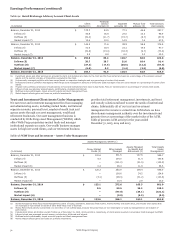
Table 9c: Wealth and Investment Management
WEALTH AND INVESTMENT MANAGEMENT (WIM)
(formerly Wealth, Brokerage and Retirement) provides a full
range of personalized wealth management, investment and
retirement products and services to clients across U.S. based
businesses including Wells Fargo Advisors, The Private Bank,
Abbot Downing, Wells Fargo Institutional Retirement and Trust,
and Wells Fargo Asset Management. We deliver financial
planning, private banking, credit, investment management and
fiduciary services to high-net worth and ultra-high-net worth
individuals and families. We also serve clients’ brokerage needs,
supply retirement and trust services to institutional clients and
provide investment management capabilities delivered to global
institutional clients through separate accounts and the
Wells Fargo Funds. WIM cross-sell was 10.55 products per retail
banking household in November 2015, up from 10.49 in
November 2014 and 10.42 in November 2013. Table 9c provides
additional financial information for WIM, with prior periods
revised to reflect the realignment of our asset management
business from Wholesale Banking to WIM and our reinsurance
business from WIM to Wholesale Banking in 2015.
Year ended December 31,
(in millions, except average balances which are in billions) 2015 2014 % Change 2013 % Change
Net interest income $ 3,478 3,032 15% $ 2,797 8%
Noninterest income:
Service charges on deposit accounts 19 18 6 17 6
Trust and investment fees:
Brokerage advisory, commissions and other fees 9,154 8,933 2 8,207 9
Trust and investment management 3,017 3,045 (1) 2,911 5
Investment banking (1) — (13) 100 (16) 19
Total trust and investment fees 12,171 11,965 2 11,102 8
Card fees 5 4 25 4 —
Other fees 17 17 — 20 (15)
Mortgage banking (7) 1 (800) (24) 104
Insurance — — NM — NM
Net gains from trading activities 41 139 (71) 288 (52)
Net gains on debt securities — 4 (100) 1 300
Net gains from equity investments 5 25 (80) 19 32
Other income of the segment 48 64 (25) 106 (40)
Total noninterest income 12,299 12,237 1 11,533 6
Total revenue 15,777 15,269 3 14,330 7
Reversal of provision for credit losses (25) (50) 50 (16) (213)
Noninterest expense:
Personnel expense 7,820 7,851 — 7,602 3
Equipment 57 62 (8) 72 (14)
Net occupancy 447 435 3 426 2
Core deposit and other intangibles 326 359 (9) 392 (8)
FDIC and other deposit assessments 123 126 (2) 135 (7)
Outside professional services 846 877 (4) 782 12
Operating losses 229 134 71 99 35
Other expense of the segment 2,219 2,149 3 1,978 9
Total noninterest expense 12,067 11,993 1 11,486 4
Income before income tax expense and noncontrolling interest 3,735 3,326 12 2,860 16
Income tax expense 1,420 1,262 13 1,082 17
Net income (loss) from noncontrolling interest (1) 4 (125) 12 (67)
Net income $ 2,316 2,060 12% $ 1,766 17%
Average loans $ 60.1 52.1 15% $ 46.2 13%
Average deposits 172.3 163.5 5 158.9 3
NM - Not meaningful
(1) Includes syndication and underwriting fees paid to Wells Fargo Securities which are offset in our Wholesale Banking segment.
Wells Fargo & Company
50