Wells Fargo 2015 Annual Report Download - page 182
Download and view the complete annual report
Please find page 182 of the 2015 Wells Fargo annual report below. You can navigate through the pages in the report by either clicking on the pages listed below, or by using the keyword search tool below to find specific information within the annual report.-
 1
1 -
2
-
3
-
4
-
5
-
6
-
7
-
8
-
9
-
10
-
11
-
12
-
13
-
14
-
15
-
16
-
17
-
18
-
19
-
20
-
21
-
22
-
23
-
24
-
25
-
26
-
27
-
28
-
29
-
30
-
31
-
32
-
33
-
34
-
35
-
36
-
37
-
38
-
39
-
40
-
41
-
42
-
43
-
44
-
45
-
46
-
47
-
48
-
49
-
50
-
51
-
52
-
53
-
54
-
55
-
56
-
57
-
58
-
59
-
60
-
61
-
62
-
63
-
64
-
65
-
66
-
67
-
68
-
69
-
70
-
71
-
72
-
73
-
74
-
75
-
76
-
77
-
78
-
79
-
80
-
81
-
82
-
83
-
84
-
85
-
86
-
87
-
88
-
89
-
90
-
91
-
92
-
93
-
94
-
95
-
96
-
97
-
98
-
99
-
100
-
101
-
102
-
103
-
104
-
105
-
106
-
107
-
108
-
109
-
110
-
111
-
112
-
113
-
114
-
115
-
116
-
117
-
118
-
119
-
120
-
121
-
122
-
123
-
124
-
125
-
126
-
127
-
128
-
129
-
130
-
131
-
132
-
133
-
134
-
135
-
136
-
137
-
138
-
139
-
140
-
141
-
142
-
143
-
144
-
145
-
146
-
147
-
148
-
149
-
150
-
151
-
152
-
153
-
154
-
155
-
156
-
157
-
158
-
159
-
160
-
161
-
162
-
163
-
164
-
165
-
166
-
167
-
168
-
169
-
170
-
171
-
 172
172 -
 173
173 -
 174
174 -
 175
175 -
 176
176 -
 177
177 -
 178
178 -
 179
179 -
 180
180 -
 181
181 -
 182
182 -
 183
183 -
 184
184 -
 185
185 -
 186
186 -
 187
187 -
 188
188 -
 189
189 -
 190
190 -
 191
191 -
 192
192 -
193
-
194
-
195
-
196
-
197
-
198
-
199
-
200
-
201
-
202
-
203
-
204
-
205
-
206
-
207
-
208
-
209
-
210
-
211
-
212
-
213
-
214
-
215
-
216
-
217
-
218
-
219
-
220
-
221
-
222
-
223
-
224
-
225
-
226
-
227
-
228
-
229
-
230
-
231
-
232
-
233
-
234
-
235
-
236
-
237
-
238
-
239
-
240
-
241
-
242
-
243
-
244
-
245
-
246
-
247
-
248
-
249
-
250
-
251
-
252
-
253
-
254
-
255
-
256
-
257
-
258
-
259
-
260
-
261
-
262
-
263
-
264
-
265
-
266
-
267
-
268
-
269
-
270
-
271
-
272
-
273
 |
 |

Note 7: Premises, Equipment, Lease Commitments and Other Assets
Table 7.1: Premises and Equipment
(in millions) Dec 31,
2015
Dec 31,
2014
Land
Buildings
Furniture and equipment
Leasehold improvements
Premises and equipment leased under
capital leases
$ 1,743
8,479
7,289
2,131
79
1,748
8,155
7,215
2,009
79
Total premises and equipment
Less: Accumulated depreciation and
amortization
19,721
11,017
19,206
10,463
Net book value, premises and
equipment $ 8,704 8,743
Depreciation and amortization expense for premises and
equipment was $1.2 billion in 2015, 2014 and 2013, respectively.
Dispositions of premises and equipment, included in
noninterest expense, resulted in a net gain of $75 million in
2015, a net gain of $28 million in 2014 and a net loss of
$15 million in 2013.
We have obligations under a number of noncancelable
operating leases for premises and equipment. The leases
predominantly expire over the next fifteen years, with the
longest expiring in 2105, and many provide for periodic
adjustment of rentals based on changes in various economic
indicators. Some leases also include a renewal option. Table 7.2
provides the future minimum payments under capital leases and
noncancelable operating leases, net of sublease rentals, with
terms greater than one year as of December 31, 2015.
Table 7.2: Minimum Lease Payments
(in millions)
Operating
leases
Capital
leases
Year ended December 31,
2016 $ 1,131 2
2017 1,026 2
2018 902 3
2019 781 3
2020 628 3
Thereafter 2,234 6
Total minimum lease payments $ 6,702 19
Executory costs $ (7)
Amounts representing interest (4)
Present value of net minimum lease
payments $ 8
Operating lease rental expense (predominantly for
premises), net of rental income, was $1.3 billion, in 2015, 2014
and 2013, respectively.
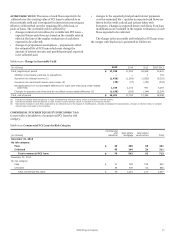
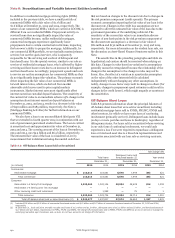
Table 7.3 presents the components of other assets.
Table 7.3: Other Assets
Dec 31, Dec 31,
(in millions) 2015 2014
Nonmarketable equity investments:
Cost method:
Federal bank stock $ 4,814 4,733
Private equity 1,626 2,300
Auction rate securities (1) 595 —
Total cost method 7,035 7,033
Equity method:
LIHTC (2) 8,314 7,278
Private equity 3,300 3,043
Tax-advantaged renewable energy 1,625 1,710
New market tax credit and other 408 379
Total equity method 13,647 12,410
Fair value (3) 3,065 2,512
Total nonmarketable equity
investments 23,747 21,955
Corporate/bank-owned life insurance 19,199 18,982
Accounts receivable (4) 26,251 27,151
Interest receivable 5,065 4,871
Core deposit intangibles 2,539 3,561
Customer relationship and other amortized
intangibles 614 857
Foreclosed assets:
Residential real estate:
Government insured/guaranteed (4) 446 982
Non-government insured/guaranteed 414 671
Non-residential real estate 565 956
Operating lease assets 3,782 2,714
Due from customers on acceptances 273 201
Other (5) 17,887 16,156
Total other assets $ 100,782 99,057
(1) Reflects auction rate perpetual preferred equity securities that were
reclassified during 2015 with a cost basis of $689 million (fair value of
$640 million) from available-for-sale securities because they do not trade on a
qualified exchange.
(2) Represents low income housing tax credit investments.
(3) Represents nonmarketable equity investments for which we have elected the
fair value option. See Note 17 (Fair Values of Assets and Liabilities) for
additional information.
(4) Certain government-guaranteed residential real estate mortgage loans upon
foreclosure are included in Accounts receivable. Both principal and interest
related to these foreclosed real estate assets are collectible because the loans
were predominantly insured by the FHA or guaranteed by the VA.
(5) Includes derivatives designated as hedging instruments, derivatives not
designated as hedging instruments, and derivative loan commitments, which
are carried at fair value. See Note 16 (Derivatives) for additional information.
Wells Fargo & Company
180