Wells Fargo 2015 Annual Report Download - page 57
Download and view the complete annual report
Please find page 57 of the 2015 Wells Fargo annual report below. You can navigate through the pages in the report by either clicking on the pages listed below, or by using the keyword search tool below to find specific information within the annual report.-
 1
1 -
2
-
3
-
4
-
5
-
6
-
7
-
8
-
9
-
10
-
11
-
12
-
13
-
14
-
15
-
16
-
17
-
18
-
19
-
20
-
21
-
22
-
23
-
24
-
25
-
26
-
27
-
28
-
29
-
30
-
31
-
32
-
33
-
34
-
35
-
36
-
37
-
38
-
39
-
40
-
41
-
42
-
43
-
44
-
45
-
46
-
 47
47 -
 48
48 -
 49
49 -
 50
50 -
 51
51 -
 52
52 -
 53
53 -
 54
54 -
 55
55 -
 56
56 -
 57
57 -
 58
58 -
 59
59 -
 60
60 -
 61
61 -
 62
62 -
 63
63 -
 64
64 -
 65
65 -
 66
66 -
 67
67 -
68
-
69
-
70
-
71
-
72
-
73
-
74
-
75
-
76
-
77
-
78
-
79
-
80
-
81
-
82
-
83
-
84
-
85
-
86
-
87
-
88
-
89
-
90
-
91
-
92
-
93
-
94
-
95
-
96
-
97
-
98
-
99
-
100
-
101
-
102
-
103
-
104
-
105
-
106
-
107
-
108
-
109
-
110
-
111
-
112
-
113
-
114
-
115
-
116
-
117
-
118
-
119
-
120
-
121
-
122
-
123
-
124
-
125
-
126
-
127
-
128
-
129
-
130
-
131
-
132
-
133
-
134
-
135
-
136
-
137
-
138
-
139
-
140
-
141
-
142
-
143
-
144
-
145
-
146
-
147
-
148
-
149
-
150
-
151
-
152
-
153
-
154
-
155
-
156
-
157
-
158
-
159
-
160
-
161
-
162
-
163
-
164
-
165
-
166
-
167
-
168
-
169
-
170
-
171
-
172
-
173
-
174
-
175
-
176
-
177
-
178
-
179
-
180
-
181
-
182
-
183
-
184
-
185
-
186
-
187
-
188
-
189
-
190
-
191
-
192
-
193
-
194
-
195
-
196
-
197
-
198
-
199
-
200
-
201
-
202
-
203
-
204
-
205
-
206
-
207
-
208
-
209
-
210
-
211
-
212
-
213
-
214
-
215
-
216
-
217
-
218
-
219
-
220
-
221
-
222
-
223
-
224
-
225
-
226
-
227
-
228
-
229
-
230
-
231
-
232
-
233
-
234
-
235
-
236
-
237
-
238
-
239
-
240
-
241
-
242
-
243
-
244
-
245
-
246
-
247
-
248
-
249
-
250
-
251
-
252
-
253
-
254
-
255
-
256
-
257
-
258
-
259
-
260
-
261
-
262
-
263
-
264
-
265
-
266
-
267
-
268
-
269
-
270
-
271
-
272
-
273
 |
 |

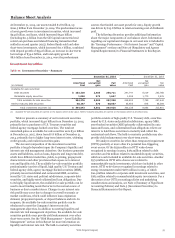
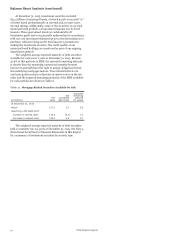
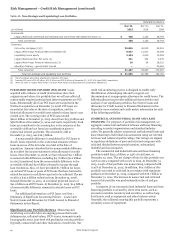
Loan Portfolio
Total loans were $916.6 billion at December 31, 2015, up
$54.0 billion from December 31, 2014. Table 12 provides a
summary of total outstanding loans by core and non-strategic/
liquidating loan portfolios. Loans in the core portfolio grew
$62.8 billion from December 31, 2014, primarily due to growth
in commercial and industrial and real estate mortgage loans
within the commercial loan portfolio segment, which included
$11.5 billion from the GE Capital commercial real estate loan
purchase and related financing transaction that settled in second
Table 12: Loan Portfolios
quarter 2015. Non-strategic/liquidating portfolios decreased by
$8.8 billion compared with a $20.1 billion decrease in 2014,
which included $10.7 billion primarily due to sale of our
government guaranteed student loan portfolio. Additional
information on the non-strategic and liquidating loan portfolios
is included in Table 18 in the “Risk Management – Credit Risk
Management” section in this Report.
December 31, 2015 December 31, 2014
(in millions) Core
Non-strategic
and liquidating Total Core
Non-strategic
and liquidating Total
Commercial $ 456,115 468 456,583 413,701 1,125 414,826
Consumer 408,489 51,487 459,976 388,062 59,663 447,725
Total loans 864,604 51,955 916,559 801,763 60,788 862,551
Change from prior year $ 62,841 (8,833) 54,008 60,343 (20,078) 40,265
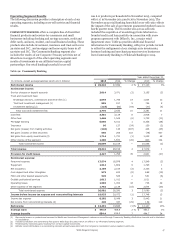
A discussion of average loan balances and a comparative
detail of average loan balances is included in Table 5 under
“Earnings Performance – Net Interest Income” earlier in this
Report. Additional information on total loans outstanding by
portfolio segment and class of financing receivable is included in
the “Risk Management – Credit Risk Management” section in
this Report. Period-end balances and other loan related
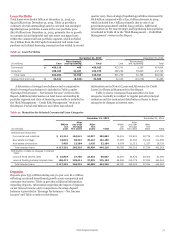
Table 13: Maturities for Selected Commercial Loan Categories
information are in Note 6 (Loans and Allowance for Credit
Losses) to Financial Statements in this Report.
Table 13 shows contractual loan maturities for loan
categories normally not subject to regular periodic principal
reduction and the contractual distribution of loans in those
categories to changes in interest rates.
December 31, 2015 December 31, 2014
After After
(in millions)
Within
one
year
one year
through
five years
After
five
years Total
Within
one
year
one year
through
five years
After
five
years Total
Selected loan maturities:
Commercial and industrial $ 91,214 184,641 24,037 299,892 76,216 172,801 22,778 271,795
Real estate mortgage 18,622 68,391 35,147 122,160 17,485 61,092 33,419 111,996
Real estate construction 7,455 13,284 1,425 22,164 6,079 11,312 1,337 18,728
Total selected loans $ 117,291 266,316 60,609 444,216 99,780 245,205 57,534 402,519
Distribution of loans to changes in interest
rates:
Loans at fixed interest rates $ 16,819 27,705 23,533 68,057 15,574 25,429 20,002 61,005
Loans at floating/variable interest rates 100,472 238,611 37,076 376,159 84,206 219,776 37,532 341,514
Total selected loans $ 117,291 266,316 60,609 444,216 99,780 245,205 57,534 402,519
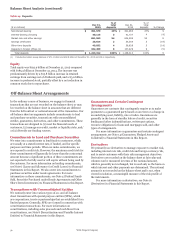
Deposits
Deposits grew $55.0 billion during 2015 to just over $1.2 trillion,
reflecting continued broad-based growth across commercial and
consumer businesses. Table 14 provides additional information
regarding deposits. Information regarding the impact of deposits
on net interest income and a comparison of average deposit
balances is provided in “Earnings Performance – Net Interest
Income” and Table 5 earlier in this Report.
Wells Fargo & Company
55