Wells Fargo 2015 Annual Report Download - page 43
Download and view the complete annual report
Please find page 43 of the 2015 Wells Fargo annual report below. You can navigate through the pages in the report by either clicking on the pages listed below, or by using the keyword search tool below to find specific information within the annual report.-
 1
1 -
2
-
3
-
4
-
5
-
6
-
7
-
8
-
9
-
10
-
11
-
12
-
13
-
14
-
15
-
16
-
17
-
18
-
19
-
20
-
21
-
22
-
23
-
24
-
25
-
26
-
27
-
28
-
29
-
30
-
31
-
32
-
 33
33 -
 34
34 -
 35
35 -
 36
36 -
 37
37 -
 38
38 -
 39
39 -
 40
40 -
 41
41 -
 42
42 -
 43
43 -
 44
44 -
 45
45 -
 46
46 -
 47
47 -
 48
48 -
 49
49 -
 50
50 -
 51
51 -
 52
52 -
 53
53 -
54
-
55
-
56
-
57
-
58
-
59
-
60
-
61
-
62
-
63
-
64
-
65
-
66
-
67
-
68
-
69
-
70
-
71
-
72
-
73
-
74
-
75
-
76
-
77
-
78
-
79
-
80
-
81
-
82
-
83
-
84
-
85
-
86
-
87
-
88
-
89
-
90
-
91
-
92
-
93
-
94
-
95
-
96
-
97
-
98
-
99
-
100
-
101
-
102
-
103
-
104
-
105
-
106
-
107
-
108
-
109
-
110
-
111
-
112
-
113
-
114
-
115
-
116
-
117
-
118
-
119
-
120
-
121
-
122
-
123
-
124
-
125
-
126
-
127
-
128
-
129
-
130
-
131
-
132
-
133
-
134
-
135
-
136
-
137
-
138
-
139
-
140
-
141
-
142
-
143
-
144
-
145
-
146
-
147
-
148
-
149
-
150
-
151
-
152
-
153
-
154
-
155
-
156
-
157
-
158
-
159
-
160
-
161
-
162
-
163
-
164
-
165
-
166
-
167
-
168
-
169
-
170
-
171
-
172
-
173
-
174
-
175
-
176
-
177
-
178
-
179
-
180
-
181
-
182
-
183
-
184
-
185
-
186
-
187
-
188
-
189
-
190
-
191
-
192
-
193
-
194
-
195
-
196
-
197
-
198
-
199
-
200
-
201
-
202
-
203
-
204
-
205
-
206
-
207
-
208
-
209
-
210
-
211
-
212
-
213
-
214
-
215
-
216
-
217
-
218
-
219
-
220
-
221
-
222
-
223
-
224
-
225
-
226
-
227
-
228
-
229
-
230
-
231
-
232
-
233
-
234
-
235
-
236
-
237
-
238
-
239
-
240
-
241
-
242
-
243
-
244
-
245
-
246
-
247
-
248
-
249
-
250
-
251
-
252
-
253
-
254
-
255
-
256
-
257
-
258
-
259
-
260
-
261
-
262
-
263
-
264
-
265
-
266
-
267
-
268
-
269
-
270
-
271
-
272
-
273
 |
 |

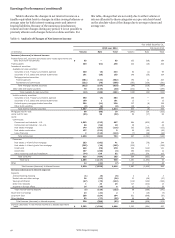
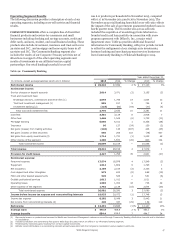
Noninterest Income
Table 7: Noninterest Income
(in millions)
Y
2015
ear ended Dec
2014
ember 31,
2013
Service charges on deposit accounts $ 5,168 5,050 5,023
Trust and investment fees:
Brokerage advisory, commissions
and other fees 9,435 9,183 8,395
Trust and investment management 3,394 3,387 3,289
Investment banking 1,639 1,710 1,746
Total trust and investment fees 14,468 14,280 13,430
Card fees 3,720 3,431 3,191
Other fees:
Charges and fees on loans 1,228 1,316 1,540
Merchant processing fees (1) 607 726 669
Cash network fees 522 507 493
Commercial real estate
brokerage commissions 618 469 338
Letters of credit fees 353 390 410
All other fees 996 941 890
Total other fees 4,324 4,349 4,340
Mortgage banking:
Servicing income, net 2,441 3,337 1,920
Net gains on mortgage loan
origination/sales activities 4,060 3,044 6,854
Total mortgage banking 6,501 6,381 8,774
Insurance 1,694 1,655 1,814
Net gains from trading activities 614 1,161 1,623
Net gains (losses) on debt securities 952 593 (29)
Net gains from equity investments 2,230 2,380 1,472
Lease income 621 526 663
Life insurance investment income 579 558 566
All other (1) (115) 456 113
Total $ 40,756 40,820 40,980
(1) Reflects deconsolidation of the Company's merchant services joint venture in
fourth quarter 2015. The Company's proportionate share of earnings is now
reflected in all other income.
Noninterest income of $40.8 billion represented 47% of revenue
for 2015, compared with $40.8 billion, or 48%, for 2014 and
$41.0 billion, or 49%, for 2013. The small decline in noninterest
income in 2015 was primarily driven by lower gains from trading
activity and all other income, mostly offset by growth in many of
our businesses, including credit and debit cards, mortgage,
commercial banking, commercial real estate brokerage, multi-
family capital, reinsurance, municipal products, and retail
brokerage. The decrease in noninterest income in 2014
compared with 2013 was primarily due to a decline in mortgage
banking, partially offset by growth in many of our other
businesses.
Service charges on deposit accounts were $5.2 billion in
2015, up from $5.1 billion in 2014 due to account growth, higher
commercial deposit product sales and commercial deposit
product re-pricing, partially offset by lower overdraft fees driven
by changes we implemented in early October 2014. Service
charges on deposits increased $27 million in 2014 from 2013 due
to account growth, new commercial deposit product sales and
commercial deposit product re-pricing, partially offset by lower
overdraft fees driven by changes we implemented in early
October 2014 designed to provide customers with more real time
information to manage their deposit accounts and avoid
overdrafts.
Brokerage advisory, commissions and other fees are
received for providing full-service and discount brokerage
services predominantly to retail brokerage clients. Income from
these brokerage-related activities include asset-based fees for
advisory accounts, which are based on the market value of the
client’s assets, and transactional commissions based on the
number and size of transactions executed at the client’s
direction. These fees increased to $9.4 billion in 2015, from
$9.2 billion and $8.4 billion in 2014 and 2013, respectively. The
increase in these fees for 2015 was primarily due to growth in
asset-based fees driven by higher average advisory account
assets in 2015 than 2014. The increase for 2014 was
predominantly due to higher asset-based fees as a result of
higher market values and growth in advisory account assets.
Retail brokerage client assets totaled $1.39 trillion at
December 31, 2015, compared with $1.42 trillion and
$1.36 trillion at December 31, 2014 and 2013, respectively, with
all retail brokerage services provided by our Wealth and
Investment Management (WIM) operating segment. For
additional information on retail brokerage client assets, see the
discussion and Tables 9d and 9e in the "Operating Segment
Results – Wealth and Investment Management – Retail
Brokerage Client Assets" section in this Report.
We earn trust and investment management fees from
managing and administering assets, including mutual funds,
institutional separate accounts, corporate trust, personal trust,
employee benefit trust and agency assets. Trust and investment
management fee income is predominantly from client assets
under management (AUM) for which the fees are determined
based on a tiered scale relative to the market value of the AUM.
AUM consists of assets for which we have investment
management discretion. Our AUM totaled $653.4 billion at
December 31, 2015, compared with $661.6 billion and
$647.2 billion at December 31, 2014 and 2013, respectively, with
substantially all of our AUM managed by our WIM operating
segment. Additional information regarding our WIM operating
segment AUM is provided in Table 9f and the related discussion
in the "Operating Segment Results – Wealth and Investment
Management – Trust and Investment Client Assets Under
Management" section in this Report. In addition to AUM we
have client assets under administration (AUA) that earn various
administrative fees which are generally based on the extent of
the services provided to administer the account. Our AUA
totaled $1.4 trillion at December 31, 2015, compared with
$1.5 trillion and $1.4 trillion at December 31, 2014 and 2013,
respectively. Trust and investment management fees of
$3.4 billion in 2015 remained stable compared with 2014, but
increased $98 million in 2014 compared with 2013, substantially
due to growth in AUM reflecting higher market values.
We earn investment banking fees from underwriting debt
and equity securities, arranging loan syndications, and
performing other related advisory services. Investment banking
fees decreased to $1.6 billion in 2015 from $1.7 billion in 2014,
driven by reductions in equity capital markets and loan
syndications partially offset by increased fees in advisory
services and investment-grade debt origination. Investment
banking fees remained unchanged at $1.7 billion in 2014
compared with 2013 as higher advisory services results were
offset by lower loan syndication and origination fees.
Card fees were $3.7 billion in 2015, compared with
$3.4 billion in 2014 and $3.2 billion in 2013. Card fees increased
in 2015 and 2014 primarily due to account growth and increased
purchase activity.
Other fees of $4.3 billion in 2015 were unchanged compared
with 2014 as increases in commercial real estate brokerage
commissions were offset by lower charges and fees on loans
primarily due to the phase out of the direct deposit advance
product during the first half of 2014, and lower merchant
processing fees. The decrease in merchant processing fees
reflected deconsolidation of our merchant services joint venture
in fourth quarter 2015, which resulted in our proportionate
Wells Fargo & Company
41