Wells Fargo 2015 Annual Report Download - page 156
Download and view the complete annual report
Please find page 156 of the 2015 Wells Fargo annual report below. You can navigate through the pages in the report by either clicking on the pages listed below, or by using the keyword search tool below to find specific information within the annual report.-
 1
1 -
2
-
3
-
4
-
5
-
6
-
7
-
8
-
9
-
10
-
11
-
12
-
13
-
14
-
15
-
16
-
17
-
18
-
19
-
20
-
21
-
22
-
23
-
24
-
25
-
26
-
27
-
28
-
29
-
30
-
31
-
32
-
33
-
34
-
35
-
36
-
37
-
38
-
39
-
40
-
41
-
42
-
43
-
44
-
45
-
46
-
47
-
48
-
49
-
50
-
51
-
52
-
53
-
54
-
55
-
56
-
57
-
58
-
59
-
60
-
61
-
62
-
63
-
64
-
65
-
66
-
67
-
68
-
69
-
70
-
71
-
72
-
73
-
74
-
75
-
76
-
77
-
78
-
79
-
80
-
81
-
82
-
83
-
84
-
85
-
86
-
87
-
88
-
89
-
90
-
91
-
92
-
93
-
94
-
95
-
96
-
97
-
98
-
99
-
100
-
101
-
102
-
103
-
104
-
105
-
106
-
107
-
108
-
109
-
110
-
111
-
112
-
113
-
114
-
115
-
116
-
117
-
118
-
119
-
120
-
121
-
122
-
123
-
124
-
125
-
126
-
127
-
128
-
129
-
130
-
131
-
132
-
133
-
134
-
135
-
136
-
137
-
138
-
139
-
140
-
141
-
142
-
143
-
144
-
145
-
 146
146 -
 147
147 -
 148
148 -
 149
149 -
 150
150 -
 151
151 -
 152
152 -
 153
153 -
 154
154 -
 155
155 -
 156
156 -
 157
157 -
 158
158 -
 159
159 -
 160
160 -
 161
161 -
 162
162 -
 163
163 -
 164
164 -
 165
165 -
 166
166 -
167
-
168
-
169
-
170
-
171
-
172
-
173
-
174
-
175
-
176
-
177
-
178
-
179
-
180
-
181
-
182
-
183
-
184
-
185
-
186
-
187
-
188
-
189
-
190
-
191
-
192
-
193
-
194
-
195
-
196
-
197
-
198
-
199
-
200
-
201
-
202
-
203
-
204
-
205
-
206
-
207
-
208
-
209
-
210
-
211
-
212
-
213
-
214
-
215
-
216
-
217
-
218
-
219
-
220
-
221
-
222
-
223
-
224
-
225
-
226
-
227
-
228
-
229
-
230
-
231
-
232
-
233
-
234
-
235
-
236
-
237
-
238
-
239
-
240
-
241
-
242
-
243
-
244
-
245
-
246
-
247
-
248
-
249
-
250
-
251
-
252
-
253
-
254
-
255
-
256
-
257
-
258
-
259
-
260
-
261
-
262
-
263
-
264
-
265
-
266
-
267
-
268
-
269
-
270
-
271
-
272
-
273
 |
 |

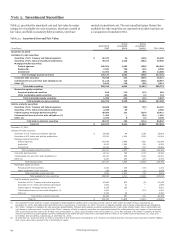
Note 5: Investment Securities
Table 5.1 provides the amortized cost and fair value by major carried at amortized cost. The net unrealized gains (losses) for
categories of available-for-sale securities, which are carried at available-for-sale securities are reported on an after-tax basis as
fair value, and held-to-maturity debt securities, which are a component of cumulative OCI.
Table 5.1: Amortized Cost and Fair Value
(in millions)
Amortized
Cost
Gross
unrealized
gains
Gross
unrealized
losses Fair value
December 31, 2015
Available-for-sale securities:
Securities of U.S. Treasury and federal agencies $ 36,374 24 (148) 36,250
Securities of U.S. states and political subdivisions 49,167 1,325 (502) 49,990
Mortgage-backed securities:
Federal agencies 103,391 1,983 (828) 104,546
Residential 7,843 740 (25) 8,558
Commercial 13,943 230 (85) 14,088
Total mortgage-backed securities 125,177 2,953 (938) 127,192
Corporate debt securities 15,548 312 (449) 15,411
Collateralized loan and other debt obligations (1) 31,210 125 (368) 30,967
Other (2) 5,842 115 (46) 5,911
Total debt securities 263,318 4,854 (2,451) 265,721
Marketable equity securities:
Perpetual preferred securities 819 112 (13) 918
Other marketable equity securities 239 482 (2) 719
Total marketable equity securities
Total available-for-sale securities
1,058
264,376
594
5,448
(15)
(2,466)
1,637
267,358
Held-to-maturity securities:
Securities of U.S. Treasury and federal agencies 44,660 580 (73) 45,167
Securities of U.S. states and political subdivisions 2,185 65 — 2,250
Federal agency mortgage-backed securities 28,604 131 (314) 28,421
Collateralized loans and other debt obligations (1) 1,405 — (24) 1,381
Other (2) 3,343 8 (3) 3,348
Total held-to-maturity securities 80,197 784 (414) 80,567
Total (3) $ 344,573 6,232 (2,880) 347,925
December 31, 2014
Available-for-sale securities:
Securities of U.S. Treasury and federal agencies $ 25,898 44 (138) 25,804
Securities of U.S. states and political subdivisions 43,939 1,504 (499) 44,944
Mortgage-backed securities:
Federal agencies 107,850 2,990 (751) 110,089
Residential 8,213 1,080 (24) 9,269
Commercial 16,248 803 (57) 16,994
Total mortgage-backed securities 132,311 4,873 (832) 136,352
Corporate debt securities
Collateralized loan and other debt obligations (1)
Other (2)
Total debt securities
14,211
25,137
6,251
247,747
745
408
295
7,869
(170)
(184)
(27)
(1,850)
14,786
25,361
6,519
253,766
Marketable equity securities:
Perpetual preferred securities
Other marketable equity securities
Total marketable equity securities
1,622
284
1,906
148
1,694
1,842
(70)
(2)
(72)
1,700
1,976
3,676
Total available-for-sale-securities 249,653 9,711 (1,922) 257,442
Held-to-maturity securities:
Securities of U.S. Treasury and federal agencies 40,886 670 (8) 41,548
Securities of U.S. states and political subdivisions 1,962 27 — 1,989
Federal agency mortgage-backed securities 5,476 165 — 5,641
Collateralized loans and other debt obligations (1) 1,404 — (13) 1,391
Other (2) 5,755 35 — 5,790
Total held-to-maturity securities 55,483 897 (21) 56,359
Total (3) $ 305,136 10,608 (1,943) 313,801
(1) The available-for-sale portfolio includes collateralized debt obligations (CDOs) with a cost basis and fair value of $247 million and $257 million, respectively, at
December 31, 2015, and $364 million and $500 million, respectively, at December 31, 2014. The held-to-maturity portfolio only includes collateralized loan obligations.
(2) The “Other” category of available-for-sale securities predominantly includes asset-backed securities collateralized by credit cards, student loans, home equity loans and
auto leases or loans and cash. Included in the “Other” category of held-to-maturity securities are asset-backed securities collateralized by auto leases or loans and cash
with a cost basis and fair value of $1.9 billion each at December 31, 2015, and $3.8 billion each at December 31, 2014. Also included in the “Other” category of held-to-
maturity securities are asset-backed securities collateralized by dealer floorplan loans with a cost basis and fair value of $1.4 billion each at December 31, 2015, and
$1.9 billion and $2.0 billion, respectively, at December 31, 2014.
(3) At December 31, 2015 and 2014, we held no securities of any single issuer (excluding the U.S. Treasury and federal agencies and government-sponsored entities (GSEs))
with a book value that exceeded 10% of stockholders’ equity.
Wells Fargo & Company
154