Wells Fargo 2015 Annual Report Download - page 196
Download and view the complete annual report
Please find page 196 of the 2015 Wells Fargo annual report below. You can navigate through the pages in the report by either clicking on the pages listed below, or by using the keyword search tool below to find specific information within the annual report.-
 1
1 -
2
-
3
-
4
-
5
-
6
-
7
-
8
-
9
-
10
-
11
-
12
-
13
-
14
-
15
-
16
-
17
-
18
-
19
-
20
-
21
-
22
-
23
-
24
-
25
-
26
-
27
-
28
-
29
-
30
-
31
-
32
-
33
-
34
-
35
-
36
-
37
-
38
-
39
-
40
-
41
-
42
-
43
-
44
-
45
-
46
-
47
-
48
-
49
-
50
-
51
-
52
-
53
-
54
-
55
-
56
-
57
-
58
-
59
-
60
-
61
-
62
-
63
-
64
-
65
-
66
-
67
-
68
-
69
-
70
-
71
-
72
-
73
-
74
-
75
-
76
-
77
-
78
-
79
-
80
-
81
-
82
-
83
-
84
-
85
-
86
-
87
-
88
-
89
-
90
-
91
-
92
-
93
-
94
-
95
-
96
-
97
-
98
-
99
-
100
-
101
-
102
-
103
-
104
-
105
-
106
-
107
-
108
-
109
-
110
-
111
-
112
-
113
-
114
-
115
-
116
-
117
-
118
-
119
-
120
-
121
-
122
-
123
-
124
-
125
-
126
-
127
-
128
-
129
-
130
-
131
-
132
-
133
-
134
-
135
-
136
-
137
-
138
-
139
-
140
-
141
-
142
-
143
-
144
-
145
-
146
-
147
-
148
-
149
-
150
-
151
-
152
-
153
-
154
-
155
-
156
-
157
-
158
-
159
-
160
-
161
-
162
-
163
-
164
-
165
-
166
-
167
-
168
-
169
-
170
-
171
-
172
-
173
-
174
-
175
-
176
-
177
-
178
-
179
-
180
-
181
-
182
-
183
-
184
-
185
-
 186
186 -
 187
187 -
 188
188 -
 189
189 -
 190
190 -
 191
191 -
 192
192 -
 193
193 -
 194
194 -
 195
195 -
 196
196 -
 197
197 -
 198
198 -
 199
199 -
 200
200 -
 201
201 -
 202
202 -
 203
203 -
 204
204 -
 205
205 -
 206
206 -
207
-
208
-
209
-
210
-
211
-
212
-
213
-
214
-
215
-
216
-
217
-
218
-
219
-
220
-
221
-
222
-
223
-
224
-
225
-
226
-
227
-
228
-
229
-
230
-
231
-
232
-
233
-
234
-
235
-
236
-
237
-
238
-
239
-
240
-
241
-
242
-
243
-
244
-
245
-
246
-
247
-
248
-
249
-
250
-
251
-
252
-
253
-
254
-
255
-
256
-
257
-
258
-
259
-
260
-
261
-
262
-
263
-
264
-
265
-
266
-
267
-
268
-
269
-
270
-
271
-
272
-
273
 |
 |

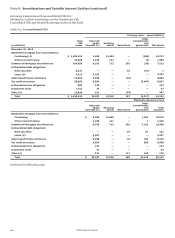
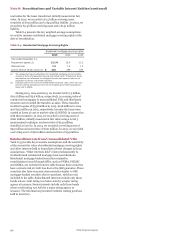
Note 9: Mortgage Banking Activities (continued)
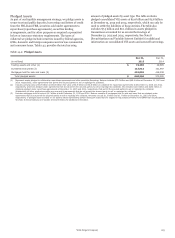
We present the components of our managed servicing
portfolio in Table 9.3 at unpaid principal balance for loans
serviced and subserviced for others and at book value for owned
loans serviced.
Table 9.3: Managed Servicing Portfolio
(in billions)
Dec 31,
2015
Dec 31,
2014
Residential mortgage servicing:
Serviced for others $ 1,300 1,405
Owned loans serviced 345 342
Subserviced for others 4 5
Total residential servicing 1,649 1,752
Commercial mortgage servicing:
Serviced for others 478 456
Owned loans serviced 122 112
Subserviced for others 7 7
Total commercial servicing 607 575
Total managed servicing portfolio $ 2,256 2,327
Total serviced for others $ 1,778 1,861
Ratio of MSRs to related loans serviced for others 0.77% 0.75
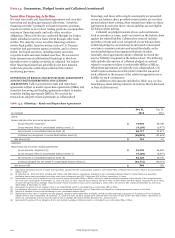
Table 9.4 presents the components of mortgage banking
noninterest income.
Table 9.4: Mortgage Banking Noninterest Income
Year ended December 31,
(in millions) 2015 2014 2013
Servicing income, net:
Servicing fees:
Contractually specified servicing fees $ 4,037 4,285 4,442
Late charges 198 203 216
Ancillary fees 288 319 343
Unreimbursed direct servicing costs (1) (625) (694) (1,074)
Net servicing fees 3,898 4,113 3,927
Changes in fair value of MSRs carried at fair value:
Due to changes in valuation model inputs or assumptions (2) (A) 214 (2,122) 3,398
Other changes in fair value (3) (2,084) (1,909) (2,242)
Total changes in fair value of MSRs carried at fair value (1,870) (4,031) 1,156
Amortization (258) (254) (254)
Net derivative gains (losses) from economic hedges (4) (B) 671 3,509 (2,909)
Total servicing income, net 2,441 3,337 1,920
Net gains on mortgage loan origination/sales activities 4,060 3,044 6,854
Total mortgage banking noninterest income $ 6,501 6,381 8,774
Market-related valuation changes to MSRs, net of hedge results (2)(4) (A)+(B) $ 885 1,387 489
(1) Primarily associated with foreclosure expenses and unreimbursed interest advances to investors.
(2) Refer to the changes in fair value of MSRs table in this Note for more detail.
(3) Represents changes due to collection/realization of expected cash flows over time.
(4) Represents results from economic hedges used to hedge the risk of changes in fair value of MSRs. See Note 16 (Derivatives Not Designated as Hedging Instruments) for
additional discussion and detail.
Wells Fargo & Company
194