Wells Fargo 2015 Annual Report Download - page 46
Download and view the complete annual report
Please find page 46 of the 2015 Wells Fargo annual report below. You can navigate through the pages in the report by either clicking on the pages listed below, or by using the keyword search tool below to find specific information within the annual report.-
 1
1 -
2
-
3
-
4
-
5
-
6
-
7
-
8
-
9
-
10
-
11
-
12
-
13
-
14
-
15
-
16
-
17
-
18
-
19
-
20
-
21
-
22
-
23
-
24
-
25
-
26
-
27
-
28
-
29
-
30
-
31
-
32
-
33
-
34
-
35
-
 36
36 -
 37
37 -
 38
38 -
 39
39 -
 40
40 -
 41
41 -
 42
42 -
 43
43 -
 44
44 -
 45
45 -
 46
46 -
 47
47 -
 48
48 -
 49
49 -
 50
50 -
 51
51 -
 52
52 -
 53
53 -
 54
54 -
 55
55 -
 56
56 -
57
-
58
-
59
-
60
-
61
-
62
-
63
-
64
-
65
-
66
-
67
-
68
-
69
-
70
-
71
-
72
-
73
-
74
-
75
-
76
-
77
-
78
-
79
-
80
-
81
-
82
-
83
-
84
-
85
-
86
-
87
-
88
-
89
-
90
-
91
-
92
-
93
-
94
-
95
-
96
-
97
-
98
-
99
-
100
-
101
-
102
-
103
-
104
-
105
-
106
-
107
-
108
-
109
-
110
-
111
-
112
-
113
-
114
-
115
-
116
-
117
-
118
-
119
-
120
-
121
-
122
-
123
-
124
-
125
-
126
-
127
-
128
-
129
-
130
-
131
-
132
-
133
-
134
-
135
-
136
-
137
-
138
-
139
-
140
-
141
-
142
-
143
-
144
-
145
-
146
-
147
-
148
-
149
-
150
-
151
-
152
-
153
-
154
-
155
-
156
-
157
-
158
-
159
-
160
-
161
-
162
-
163
-
164
-
165
-
166
-
167
-
168
-
169
-
170
-
171
-
172
-
173
-
174
-
175
-
176
-
177
-
178
-
179
-
180
-
181
-
182
-
183
-
184
-
185
-
186
-
187
-
188
-
189
-
190
-
191
-
192
-
193
-
194
-
195
-
196
-
197
-
198
-
199
-
200
-
201
-
202
-
203
-
204
-
205
-
206
-
207
-
208
-
209
-
210
-
211
-
212
-
213
-
214
-
215
-
216
-
217
-
218
-
219
-
220
-
221
-
222
-
223
-
224
-
225
-
226
-
227
-
228
-
229
-
230
-
231
-
232
-
233
-
234
-
235
-
236
-
237
-
238
-
239
-
240
-
241
-
242
-
243
-
244
-
245
-
246
-
247
-
248
-
249
-
250
-
251
-
252
-
253
-
254
-
255
-
256
-
257
-
258
-
259
-
260
-
261
-
262
-
263
-
264
-
265
-
266
-
267
-
268
-
269
-
270
-
271
-
272
-
273
 |
 |

Earnings Performance (continued)
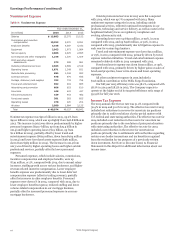
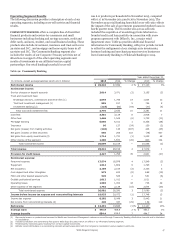
Noninterest Expense
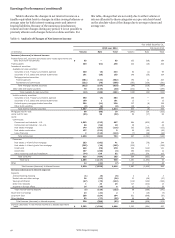
Table 8: Noninterest Expense
Year ended December 31,
(in millions) 2015 2014 2013
Salaries $ 15,883 15,375 15,152
Commission and incentive
compensation 10,352 9,970 9,951
Employee benefits 4,446 4,597 5,033
Equipment 2,063 1,973 1,984
Net occupancy 2,886 2,925 2,895
Core deposit and other intangibles 1,246 1,370 1,504
FDIC and other deposit
assessments 973 928 961
Outside professional services 2,665 2,689 2,519
Operating losses 1,871 1,249 821
Outside data processing 985 1,034 983
Contract services 978 975 935
Postage, stationery and supplies 702 733 756
Travel and entertainment 692 904 885
Advertising and promotion 606 653 610
Insurance 448 422 437
Telecommunications 439 453 482
Foreclosed assets 381 583 605
Operating leases 278 220 204
All other 2,080 1,984 2,125
Total $ 49,974 49,037 48,842
Noninterest expense was $50.0 billion in 2015, up 2% from
$49.0 billion in 2014, which was up slightly from $48.8 billion in
2013. The increase in 2015 was driven predominantly by higher
personnel expenses ($30.7 billion, up from $29.9 billion in
2014) and higher operating losses ($1.9 billion, up from
$1.2 billion in 2014), partially offset by lower travel and
entertainment expense ($692 million, down from $904 million
in 2014) and lower foreclosed assets expense ($381 million,
down from $583 million in 2014). The increase in 2014 from
2013 was driven by higher operating losses and higher outside
professional services, partially offset by lower personnel
expenses.
Personnel expenses, which include salaries, commissions,
incentive compensation and employee benefits, were up
$739 million, or 2%, compared with 2014, due to annual salary
increases, staffing growth across various businesses, and higher
revenue-related incentive compensation. Lower employee
benefits expense was predominantly due to lower deferred
compensation expense (offset in trading revenue), partially
offset by increases in other employee benefits. Personnel
expenses were down 1% in 2014, compared with 2013, due to
lower employee benefits expense, reduced staffing and lower
volume-related compensation in our mortgage business,
partially offset by increased personnel expenses in our non-
mortgage businesses.
Outside professional services in 2015 were flat compared
with 2014, which was up 7% compared with 2013. Many
noninterest expense categories in 2015, including outside
professional services, reflected continued investments in our
products, technology and service delivery, as well as costs for the
heightened industry focus on regulatory compliance and
evolving cybersecurity risk.
Operating losses were up $622 million, or 50%, in 2015
compared with 2014, and up $428 million, or 52%, in 2014
compared with 2013, predominantly due to litigation expense in
each year for various legal matters.
Travel and entertainment expense was down $212 million,
or 23%, in 2015 compared with 2014, primarily driven by travel
expense reduction initiatives. Travel and entertainment expense
remained relatively stable in 2014 compared with 2013.
Foreclosed assets expense was down $202 million, or 35%,
compared with 2014, primarily driven by higher gains on sales of
foreclosed properties, lower write-downs and lower operating
expenses.
All other noninterest expense in 2015 included a
$126 million contribution to the Wells Fargo Foundation.
Our full year 2015 efficiency ratio was 58.1%, compared with
58.1% in 2014 and 58.3% in 2013. The Company expects to
operate at the higher end of its targeted efficiency ratio range of
55-59% for full year 2016.
Income Tax Expense
The 2015 annual effective tax rate was 31.2% compared with
30.9% in 2014 and 32.2% in 2013. The effective tax rate for 2015
included net reductions in reserves for uncertain tax positions
primarily due to audit resolutions of prior period matters with
U.S. federal and state taxing authorities. The effective tax rate for
2014 included a net reduction in the reserve for uncertain tax
positions primarily due to the resolution of prior period matters
with state taxing authorities. The effective tax rate for 2013
included a net reduction in the reserve for uncertain tax
positions primarily due to settlements with authorities regarding
certain cross border transactions and tax benefits recognized
from the realization for tax purposes of a previously written
down investment. See Note 21 (Income Taxes) to Financial
Statements in this Report for additional information about our
income taxes.
Wells Fargo & Company
44