Wells Fargo 2015 Annual Report Download - page 41
Download and view the complete annual report
Please find page 41 of the 2015 Wells Fargo annual report below. You can navigate through the pages in the report by either clicking on the pages listed below, or by using the keyword search tool below to find specific information within the annual report.-
 1
1 -
2
-
3
-
4
-
5
-
6
-
7
-
8
-
9
-
10
-
11
-
12
-
13
-
14
-
15
-
16
-
17
-
18
-
19
-
20
-
21
-
22
-
23
-
24
-
25
-
26
-
27
-
28
-
29
-
30
-
 31
31 -
 32
32 -
 33
33 -
 34
34 -
 35
35 -
 36
36 -
 37
37 -
 38
38 -
 39
39 -
 40
40 -
 41
41 -
 42
42 -
 43
43 -
 44
44 -
 45
45 -
 46
46 -
 47
47 -
 48
48 -
 49
49 -
 50
50 -
 51
51 -
52
-
53
-
54
-
55
-
56
-
57
-
58
-
59
-
60
-
61
-
62
-
63
-
64
-
65
-
66
-
67
-
68
-
69
-
70
-
71
-
72
-
73
-
74
-
75
-
76
-
77
-
78
-
79
-
80
-
81
-
82
-
83
-
84
-
85
-
86
-
87
-
88
-
89
-
90
-
91
-
92
-
93
-
94
-
95
-
96
-
97
-
98
-
99
-
100
-
101
-
102
-
103
-
104
-
105
-
106
-
107
-
108
-
109
-
110
-
111
-
112
-
113
-
114
-
115
-
116
-
117
-
118
-
119
-
120
-
121
-
122
-
123
-
124
-
125
-
126
-
127
-
128
-
129
-
130
-
131
-
132
-
133
-
134
-
135
-
136
-
137
-
138
-
139
-
140
-
141
-
142
-
143
-
144
-
145
-
146
-
147
-
148
-
149
-
150
-
151
-
152
-
153
-
154
-
155
-
156
-
157
-
158
-
159
-
160
-
161
-
162
-
163
-
164
-
165
-
166
-
167
-
168
-
169
-
170
-
171
-
172
-
173
-
174
-
175
-
176
-
177
-
178
-
179
-
180
-
181
-
182
-
183
-
184
-
185
-
186
-
187
-
188
-
189
-
190
-
191
-
192
-
193
-
194
-
195
-
196
-
197
-
198
-
199
-
200
-
201
-
202
-
203
-
204
-
205
-
206
-
207
-
208
-
209
-
210
-
211
-
212
-
213
-
214
-
215
-
216
-
217
-
218
-
219
-
220
-
221
-
222
-
223
-
224
-
225
-
226
-
227
-
228
-
229
-
230
-
231
-
232
-
233
-
234
-
235
-
236
-
237
-
238
-
239
-
240
-
241
-
242
-
243
-
244
-
245
-
246
-
247
-
248
-
249
-
250
-
251
-
252
-
253
-
254
-
255
-
256
-
257
-
258
-
259
-
260
-
261
-
262
-
263
-
264
-
265
-
266
-
267
-
268
-
269
-
270
-
271
-
272
-
273
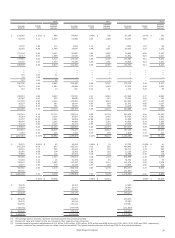
 |
 |

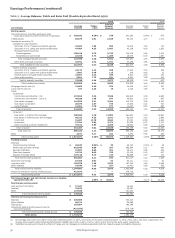
2011 2013 2012
Interest Interest Interest
Average Yields/ income/ Average Yields/ income/ Average Yields/ income/
balance rates expense balance rates expense balance rates expense
$ 154,902 0.32% $ 489 84,081 0.45% $ 378 87,186 0.40% $ 345
44,745 3.14 1,406 41,950 3.29 1,380 39,737 3.68 1,463
6,750 1.66 112 3,604 1.31 47 5,503 1.25 69
39,922 4.38 1,748 34,875 4.48 1,561 24,035 5.09 1,223
107,148 2.83 3,031 92,887 3.12 2,893 74,665 4.36 3,257
30,717 6.47 1,988 33,545 6.75 2,264 31,902 8.20 2,617
137,865 3.64 5,019 126,432 4.08 5,157 106,567 5.51 5,874
55,002 3.53 1,940 49,245 4.04 1,992 38,625 5.03 1,941
239,539 3.68 8,819 214,156 4.09 8,757 174,730 5.21 9,107
— — — — — — — — —
— — — — — — — — —
701 3.09 22 — — — — — —
16 1.99 — — — — — — —
717 3.06 22 — — — — — —
240,256 3.68 8,841 214,156 4.09 8,757 174,730 5.21 9,107
35,273 3.66 1,290 48,955 3.73 1,825 37,232 4.42 1,644
163 7.95 13 661 6.22 41 1,104 5.25 58
185,813 3.66 6,807 173,913 4.01 6,981 157,608 4.37 6,894
40,987 2.03 832 38,838 2.34 910 35,042 2.13 745
107,316 3.94 4,233 105,492 4.19 4,416 102,320 4.07 4,167
16,537 4.76 787 18,047 4.97 897 21,672 4.88 1,057
12,373 6.10 755 13,067 7.18 939 13,223 7.52 994
363,026 3.70 13,414 349,357 4.05 14,143 329,865 4.20 13,857
254,012 4.22 10,717 235,011 4.55 10,704 227,676 4.90 11,156
70,264 4.29 3,014 80,887 4.28 3,460 90,755 4.33 3,930
24,757 12.46 3,084 22,809 12.68 2,892 21,556 13.04 2,811
48,476 6.94 3,365 44,986 7.54 3,390 43,834 8.14 3,568
42,135 4.80 2,024 42,174 4.57 1,928 43,458 4.56 1,980
439,644 5.05 22,204 425,867 5.25 22,374 427,279 5.49 23,445
802,670 4.44 35,618 775,224 4.71 36,517 757,144 4.93 37,302
4,354 5.39 235 4,438 4.70 209 4,929 4.12 203
$ 1,282,363 3.73% $ 47,892 1,169,465 4.20% $ 49,107 1,102,062 4.55% $ 50,122
$ 35,570 0.06% $ 22 30,564 0.06% $ 19 47,705 0.08% $ 40
550,394 0.08 450 505,310 0.12 592 464,450 0.18 836
49,510 1.13 559 59,484 1.31 782 69,711 1.43 995
28,090 0.69 194 13,363 1.68 225 13,126 2.04 268
76,894 0.15 112 67,920 0.16 109 61,566 0.22 136
740,458 0.18 1,337 676,641 0.26 1,727 656,558 0.35 2,275
54,716 0.13 71 51,196 0.18 94 51,781 0.18 94
134,937 1.92 2,585 127,547 2.44 3,110 141,079 2.82 3,978
12,471 2.46 307 10,032 2.44 245 10,955 2.88 316
942,582 0.46 4,300 865,416 0.60 5,176 860,373 0.77 6,663
339,781 — — 304,049 — — 241,689 — —
$ 1,282,363 0.33 4,300 1,169,465 0.44 5,176 1,102,062 0.61 6,663
3.40% $ 43,592 3.76% $ 43,931 3.94% $ 43,459
$ 16,272 16,303 17,388
25,637 25,417 24,904
121,711 130,450 125,911
$ 163,620 172,170 168,203
$ 280,229 263,863 215,242
58,178 61,214 57,399
164,994 151,142 137,251
(339,781) (304,049) (241,689)
$ 163,620 172,170 168,203
$ 1,445,983 1,341,635 1,270,265
(3) The average balance amounts represent amortized cost for the periods presented.
(4) Nonaccrual loans and related income are included in their respective loan categories.
(5) Includes taxable-equivalent adjustments of $1.1 billion, $902 million, $792 million, $701 million and $696 million for 2015, 2014, 2013, 2012 and 2011, respectively,
primarily related to tax-exempt income on certain loans and securities. The federal statutory tax rate utilized was 35% for the periods presented.
Wells Fargo & Company
39