Wells Fargo 2015 Annual Report Download - page 45
Download and view the complete annual report
Please find page 45 of the 2015 Wells Fargo annual report below. You can navigate through the pages in the report by either clicking on the pages listed below, or by using the keyword search tool below to find specific information within the annual report.-
 1
1 -
2
-
3
-
4
-
5
-
6
-
7
-
8
-
9
-
10
-
11
-
12
-
13
-
14
-
15
-
16
-
17
-
18
-
19
-
20
-
21
-
22
-
23
-
24
-
25
-
26
-
27
-
28
-
29
-
30
-
31
-
32
-
33
-
34
-
 35
35 -
 36
36 -
 37
37 -
 38
38 -
 39
39 -
 40
40 -
 41
41 -
 42
42 -
 43
43 -
 44
44 -
 45
45 -
 46
46 -
 47
47 -
 48
48 -
 49
49 -
 50
50 -
 51
51 -
 52
52 -
 53
53 -
 54
54 -
 55
55 -
56
-
57
-
58
-
59
-
60
-
61
-
62
-
63
-
64
-
65
-
66
-
67
-
68
-
69
-
70
-
71
-
72
-
73
-
74
-
75
-
76
-
77
-
78
-
79
-
80
-
81
-
82
-
83
-
84
-
85
-
86
-
87
-
88
-
89
-
90
-
91
-
92
-
93
-
94
-
95
-
96
-
97
-
98
-
99
-
100
-
101
-
102
-
103
-
104
-
105
-
106
-
107
-
108
-
109
-
110
-
111
-
112
-
113
-
114
-
115
-
116
-
117
-
118
-
119
-
120
-
121
-
122
-
123
-
124
-
125
-
126
-
127
-
128
-
129
-
130
-
131
-
132
-
133
-
134
-
135
-
136
-
137
-
138
-
139
-
140
-
141
-
142
-
143
-
144
-
145
-
146
-
147
-
148
-
149
-
150
-
151
-
152
-
153
-
154
-
155
-
156
-
157
-
158
-
159
-
160
-
161
-
162
-
163
-
164
-
165
-
166
-
167
-
168
-
169
-
170
-
171
-
172
-
173
-
174
-
175
-
176
-
177
-
178
-
179
-
180
-
181
-
182
-
183
-
184
-
185
-
186
-
187
-
188
-
189
-
190
-
191
-
192
-
193
-
194
-
195
-
196
-
197
-
198
-
199
-
200
-
201
-
202
-
203
-
204
-
205
-
206
-
207
-
208
-
209
-
210
-
211
-
212
-
213
-
214
-
215
-
216
-
217
-
218
-
219
-
220
-
221
-
222
-
223
-
224
-
225
-
226
-
227
-
228
-
229
-
230
-
231
-
232
-
233
-
234
-
235
-
236
-
237
-
238
-
239
-
240
-
241
-
242
-
243
-
244
-
245
-
246
-
247
-
248
-
249
-
250
-
251
-
252
-
253
-
254
-
255
-
256
-
257
-
258
-
259
-
260
-
261
-
262
-
263
-
264
-
265
-
266
-
267
-
268
-
269
-
270
-
271
-
272
-
273
 |
 |
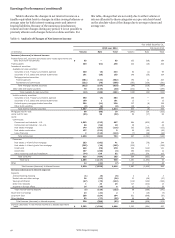
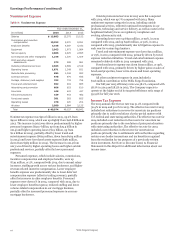
We engage in trading activities primarily to accommodate
the investment activities of our customers, and to execute
economic hedging to manage certain components of our balance
sheet risks. Net gains (losses) from trading activities, which
reflect unrealized changes in fair value of our trading positions
and realized gains and losses, were $614 million in 2015,
$1.2 billion in 2014 and $1.6 billion in 2013. The decrease in
2015 was driven by lower economic hedge income, lower trading
from customer accommodation activity, and lower deferred
compensation gains (offset in employee benefits expense). The
decrease in 2014 from 2013 was driven by lower trading from
customer accommodation activity within our capital markets
business and lower deferred compensation gains (offset in
employee benefits expense). Net gains from trading activities do
not include interest and dividend income and expense on trading
securities. Those amounts are reported within interest income
from trading assets and other interest expense from trading
liabilities. For additional information about trading activities,
see the “Risk Management – Asset/Liability Management –
Market Risk – Trading Activities” section in this Report.
Net gains on debt and equity securities totaled $3.2 billion
for 2015 and $3.0 billion and $1.4 billion for 2014 and 2013,
respectively after other-than-temporary impairment (OTTI)
write-downs of $559 million, $322 million and $344 million,
respectively, for the same periods. The increase in OTTI write-
downs in 2015 mainly reflected deterioration in energy sector
corporate debt and nonmarketable equity investments. The
increase in net gains on debt and equity securities in 2015
compared with 2014 was due to higher net gains on debt
securities combined with continued strong equity markets
throughout the majority of 2015. The increase in net gains on
debt and equity securities in 2014 compared with 2013 reflected
the benefit of strong public and private equity markets.
All other income was $(115) million for 2015 compared with
$456 million in 2014 and $113 million in 2013. All other income
includes ineffectiveness recognized on derivatives that qualify
for hedge accounting, the results of certain economic hedges,
losses on low-income housing tax credit investments, foreign
currency adjustments and income from investments accounted
for under the equity method, any of which can cause decreases
and net losses in other income. The decrease in other income in
2015 compared with 2014 primarily reflected changes in
ineffectiveness recognized on interest rate swaps used to hedge
our exposure to interest rate risk on long-term debt and cross-
currency swaps, cross-currency interest rate swaps and forward
contracts used to hedge our exposure to foreign currency risk
and interest rate risk involving non-U.S. dollar denominated
long-term debt. The decline in other income in 2015 resulting
from these changes in ineffectiveness was partially offset by our
proportionate share of earnings from a merchant services joint
venture that we deconsolidated in 2015. Higher other income for
2014 compared with 2013 primarily reflected larger hedge
ineffectiveness gains on derivatives that qualify for hedge
accounting, a gain on sale of government-guaranteed student
loans in fourth quarter 2014, and a gain on sale of 40 insurance
offices in second quarter 2014 partially offset by lower income
from equity method investments.
Wells Fargo & Company
43