Wells Fargo 2015 Annual Report Download - page 179
Download and view the complete annual report
Please find page 179 of the 2015 Wells Fargo annual report below. You can navigate through the pages in the report by either clicking on the pages listed below, or by using the keyword search tool below to find specific information within the annual report.-
 1
1 -
2
-
3
-
4
-
5
-
6
-
7
-
8
-
9
-
10
-
11
-
12
-
13
-
14
-
15
-
16
-
17
-
18
-
19
-
20
-
21
-
22
-
23
-
24
-
25
-
26
-
27
-
28
-
29
-
30
-
31
-
32
-
33
-
34
-
35
-
36
-
37
-
38
-
39
-
40
-
41
-
42
-
43
-
44
-
45
-
46
-
47
-
48
-
49
-
50
-
51
-
52
-
53
-
54
-
55
-
56
-
57
-
58
-
59
-
60
-
61
-
62
-
63
-
64
-
65
-
66
-
67
-
68
-
69
-
70
-
71
-
72
-
73
-
74
-
75
-
76
-
77
-
78
-
79
-
80
-
81
-
82
-
83
-
84
-
85
-
86
-
87
-
88
-
89
-
90
-
91
-
92
-
93
-
94
-
95
-
96
-
97
-
98
-
99
-
100
-
101
-
102
-
103
-
104
-
105
-
106
-
107
-
108
-
109
-
110
-
111
-
112
-
113
-
114
-
115
-
116
-
117
-
118
-
119
-
120
-
121
-
122
-
123
-
124
-
125
-
126
-
127
-
128
-
129
-
130
-
131
-
132
-
133
-
134
-
135
-
136
-
137
-
138
-
139
-
140
-
141
-
142
-
143
-
144
-
145
-
146
-
147
-
148
-
149
-
150
-
151
-
152
-
153
-
154
-
155
-
156
-
157
-
158
-
159
-
160
-
161
-
162
-
163
-
164
-
165
-
166
-
167
-
168
-
 169
169 -
 170
170 -
 171
171 -
 172
172 -
 173
173 -
 174
174 -
 175
175 -
 176
176 -
 177
177 -
 178
178 -
 179
179 -
 180
180 -
 181
181 -
 182
182 -
 183
183 -
 184
184 -
 185
185 -
 186
186 -
 187
187 -
 188
188 -
 189
189 -
190
-
191
-
192
-
193
-
194
-
195
-
196
-
197
-
198
-
199
-
200
-
201
-
202
-
203
-
204
-
205
-
206
-
207
-
208
-
209
-
210
-
211
-
212
-
213
-
214
-
215
-
216
-
217
-
218
-
219
-
220
-
221
-
222
-
223
-
224
-
225
-
226
-
227
-
228
-
229
-
230
-
231
-
232
-
233
-
234
-
235
-
236
-
237
-
238
-
239
-
240
-
241
-
242
-
243
-
244
-
245
-
246
-
247
-
248
-
249
-
250
-
251
-
252
-
253
-
254
-
255
-
256
-
257
-
258
-
259
-
260
-
261
-
262
-
263
-
264
-
265
-
266
-
267
-
268
-
269
-
270
-
271
-
272
-
273
 |
 |

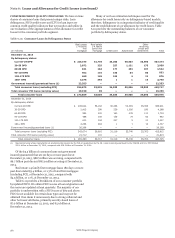
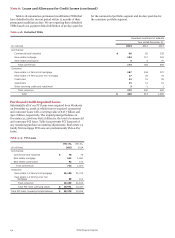
ACCRETABLE YIELD The excess of cash flows expected to be • changes in the expected principal and interest payments
collected over the carrying value of PCI loans is referred to as over the estimated life – updates to expected cash flows are
the accretable yield and is recognized in interest income using an driven by the credit outlook and actions taken with
effective yield method over the remaining life of the loan, or borrowers. Changes in expected future cash flows from loan
pools of loans. The accretable yield is affected by: modifications are included in the regular evaluations of cash
• changes in interest rate indices for variable rate PCI loans – flows expected to be collected.
expected future cash flows are based on the variable rates in
effect at the time of the regular evaluations of cash flows The change in the accretable yield related to PCI loans since
expected to be collected; the merger with Wachovia is presented in Table 6.20.
• changes in prepayment assumptions – prepayments affect
the estimated life of PCI loans which may change the
amount of interest income, and possibly principal, expected
to be collected; and
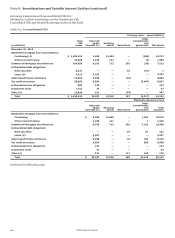
Table 6.20: Change in Accretable Yield
(in millions) 2015 2014 2013 2009-2012
Total, beginning of period
Addition of accretable yield due to acquisitions
Accretion into interest income (1)
Accretion into noninterest income due to sales (2)
Reclassification from nonaccretable difference for loans with improving credit-related
cash flows
Changes in expected cash flows that do not affect nonaccretable difference (3)
$ 17,790
—
(1,429)
(28)
1,166
(1,198)
17,392
—
(1,599)
(37)
2,243
(209)
18,548
1
(1,833)
(151)
971
(144)
10,447
131
(9,351)
(242)
5,354
12,209
Total, end of period $ 16,301 17,790 17,392 18,548
(1) Includes accretable yield released as a result of settlements with borrowers, which is included in interest income.
(2) Includes accretable yield released as a result of sales to third parties, which is included in noninterest income.
(3) Represents changes in cash flows expected to be collected due to the impact of modifications, changes in prepayment assumptions, changes in interest rates on variable
rate PCI loans and sales to third parties.
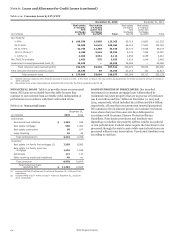
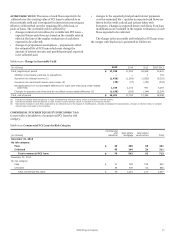
COMMERCIAL PCI CREDIT QUALITY INDICATORS Table
6.21 provides a breakdown of commercial PCI loans by risk
category.
Table 6.21: Commercial PCI Loans by Risk Category
(in millions)
Commercial
and
industrial
Real estate
mortgage
Real estate
construction Total
December 31, 2015
By risk category:
Pass $ 35 298 68 401
Criticized 43 244 24 311
Total commercial PCI loans $ 78 542 92 712
December 31, 2014
By risk category:
Pass $ 21 783 118 922
Criticized 54 478 53 585
Total commercial PCI loans $ 75 1,261 171 1,507
Wells Fargo & Company
177