Wells Fargo 2015 Annual Report Download - page 96
Download and view the complete annual report
Please find page 96 of the 2015 Wells Fargo annual report below. You can navigate through the pages in the report by either clicking on the pages listed below, or by using the keyword search tool below to find specific information within the annual report.-
 1
1 -
2
-
3
-
4
-
5
-
6
-
7
-
8
-
9
-
10
-
11
-
12
-
13
-
14
-
15
-
16
-
17
-
18
-
19
-
20
-
21
-
22
-
23
-
24
-
25
-
26
-
27
-
28
-
29
-
30
-
31
-
32
-
33
-
34
-
35
-
36
-
37
-
38
-
39
-
40
-
41
-
42
-
43
-
44
-
45
-
46
-
47
-
48
-
49
-
50
-
51
-
52
-
53
-
54
-
55
-
56
-
57
-
58
-
59
-
60
-
61
-
62
-
63
-
64
-
65
-
66
-
67
-
68
-
69
-
70
-
71
-
72
-
73
-
74
-
75
-
76
-
77
-
78
-
79
-
80
-
81
-
82
-
83
-
84
-
85
-
 86
86 -
 87
87 -
 88
88 -
 89
89 -
 90
90 -
 91
91 -
 92
92 -
 93
93 -
 94
94 -
 95
95 -
 96
96 -
 97
97 -
 98
98 -
 99
99 -
 100
100 -
 101
101 -
 102
102 -
 103
103 -
 104
104 -
 105
105 -
 106
106 -
107
-
108
-
109
-
110
-
111
-
112
-
113
-
114
-
115
-
116
-
117
-
118
-
119
-
120
-
121
-
122
-
123
-
124
-
125
-
126
-
127
-
128
-
129
-
130
-
131
-
132
-
133
-
134
-
135
-
136
-
137
-
138
-
139
-
140
-
141
-
142
-
143
-
144
-
145
-
146
-
147
-
148
-
149
-
150
-
151
-
152
-
153
-
154
-
155
-
156
-
157
-
158
-
159
-
160
-
161
-
162
-
163
-
164
-
165
-
166
-
167
-
168
-
169
-
170
-
171
-
172
-
173
-
174
-
175
-
176
-
177
-
178
-
179
-
180
-
181
-
182
-
183
-
184
-
185
-
186
-
187
-
188
-
189
-
190
-
191
-
192
-
193
-
194
-
195
-
196
-
197
-
198
-
199
-
200
-
201
-
202
-
203
-
204
-
205
-
206
-
207
-
208
-
209
-
210
-
211
-
212
-
213
-
214
-
215
-
216
-
217
-
218
-
219
-
220
-
221
-
222
-
223
-
224
-
225
-
226
-
227
-
228
-
229
-
230
-
231
-
232
-
233
-
234
-
235
-
236
-
237
-
238
-
239
-
240
-
241
-
242
-
243
-
244
-
245
-
246
-
247
-
248
-
249
-
250
-
251
-
252
-
253
-
254
-
255
-
256
-
257
-
258
-
259
-
260
-
261
-
262
-
263
-
264
-
265
-
266
-
267
-
268
-
269
-
270
-
271
-
272
-
273
 |
 |
Risk Management - Asset/Liability Management (continued)
An inventory of scenarios is maintained representing both
historical and hypothetical stress events that affect a broad range
of market risk factors with varying degrees of correlation and
differing time horizons. Hypothetical scenarios assess the impact
of large movements in financial variables on portfolio values.
Typical examples include a 1% (100 basis point) increase across
the yield curve or a 10% decline in equity market indexes.
Historical scenarios utilize an event-driven approach: the stress
scenarios are based on plausible but rare events, and the analysis
addresses how these events might affect the risk factors relevant
to a portfolio.
The Company’s stress testing framework is also used in
calculating results in support of the Federal Reserve Board’s
Comprehensive Capital Analysis and Review (CCAR) and
internal stress tests. Stress scenarios are regularly reviewed and
updated to address potential market events or concerns. For
more detail on the CCAR process, see the “Capital Management”
section in this Report.
Regulatory Market Risk Capital is based on U.S. regulatory
agency risk-based capital regulations that are based on the Basel
Committee Capital Accord of the Basel Committee on Banking
Supervision. The Company must calculate regulatory capital
based on the Basel III market risk capital rule, which requires
banking organizations with significant trading activities to adjust
their capital requirements to better account for the market risks
of those activities based on comprehensive and risk sensitive
methods and models. The market risk capital rule is intended to
cover the risk of loss in value of covered positions due to changes
in market conditions.
Composition of Material Portfolio of Covered Positions The
positions that are “covered” by the market risk capital rule are
generally a subset of our trading assets and trading liabilities,
specifically those held by the Company for the purpose of short-
term resale or with the intent of benefiting from actual or
expected short-term price movements, or to lock in arbitrage
profits. Positions excluded from market risk regulatory capital
treatment are subject to the credit risk capital rules applicable to
the “non-covered” trading positions.
The material portfolio of the Company’s “covered” positions
is predominantly concentrated in the trading assets and trading
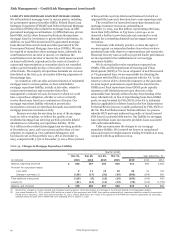
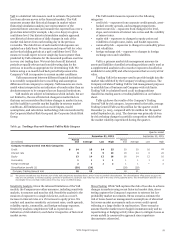
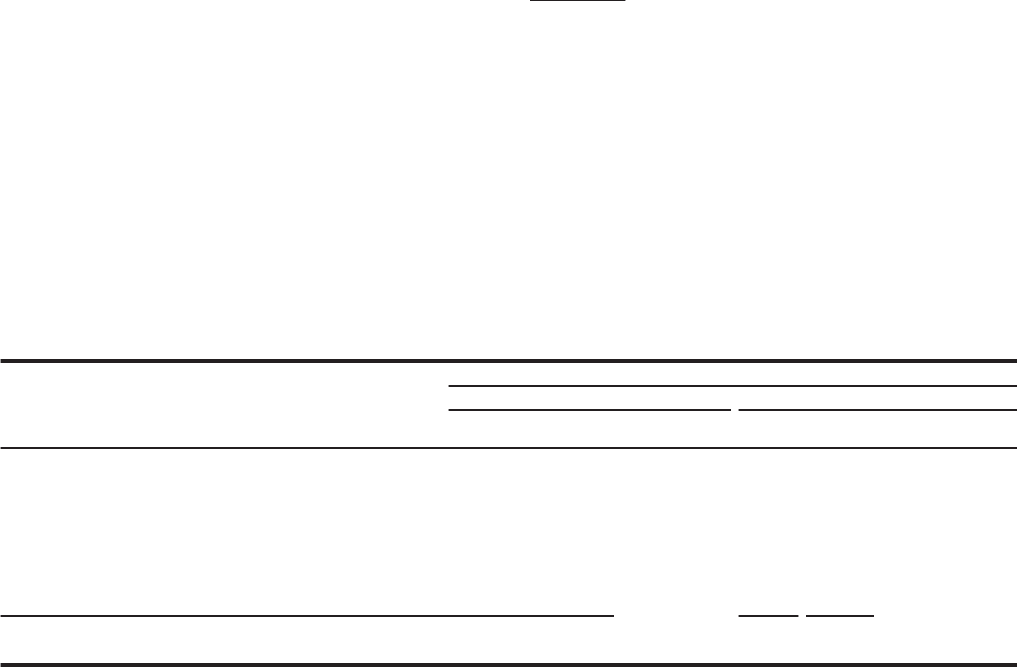
Table 44: Regulatory 10-Day 99% General VaR by Risk Category
liabilities managed within Wholesale Banking where the
substantial portion of market risk capital resides. Wholesale
Banking engages in the fixed income, traded credit, foreign
exchange, equities, and commodities markets businesses. Other
business segments also hold small trading positions covered
under the market risk capital rule.
Regulatory Market Risk Capital Components The capital
required for market risk on the Company’s “covered” positions is
determined by internally developed models or standardized
specific risk charges. The market risk regulatory capital models
are subject to internal model risk management and validation.
The models are continuously monitored and enhanced in
response to changes in market conditions, improvements in
system capabilities, and changes in the Company’s market risk
exposure. The Company is required to obtain and has received
prior written approval from its regulators before using its
internally developed models to calculate the market risk capital
charge.
Basel III prescribes various VaR measures in the
determination of regulatory capital and risk-weighted assets
(RWAs). The Company uses the same VaR models for both
market risk management purposes as well as regulatory capital
calculations. For regulatory purposes, we use the following
metrics to determine the Company’s market risk capital
requirements:
General VaR measures the risk of broad market movements such
as changes in the level of credit spreads, interest rates, equity
prices, commodity prices, and foreign exchange rates. General
VaR uses historical simulation analysis based on 99% confidence
level and a 10-day time horizon.
Table 44 shows the General VaR measure by major risk
categories for Wholesale Banking. Average 10-day Company
Regulatory General VaR was $40 million for the quarter ended
December 31, 2015, compared with $35 million for the quarter
ended September 30, 2015. The increase was primarily driven by
changes in portfolio composition.
Quarter ended
December 31, 2015 September 30, 2015
Period Period
(in millions) end Average Low High end Average Low High
Wholesale Regulatory General VaR Risk Categories
Credit $ 29 38 26 54 45 46 30 61
Interest rate 25 29 21 40 38 45 27 77
Equity 9 7 4 11 7 6 3 13
Commodity 2 3 1 5 1 3 1 5
Foreign exchange 2 2 1 5 2 4 1 6
Diversification benefit (1) (22) (41) (64) (72)
Wholesale Regulatory General VaR $ 45 38 26 54 29 32 21 56
Company Regulatory General VaR 47 40 28 56 31 35 23 58
(1) The period-end VaR was less than the sum of the VaR components described above, which is due to portfolio diversification. The diversification benefit arises because the
risks are not perfectly correlated causing a portfolio of positions to usually be less risky than the sum of the risks of the positions alone. The diversification benefit is not
meaningful for low and high metrics since they may occur on different days.
Wells Fargo & Company
94