Wells Fargo 2015 Annual Report Download - page 106
Download and view the complete annual report
Please find page 106 of the 2015 Wells Fargo annual report below. You can navigate through the pages in the report by either clicking on the pages listed below, or by using the keyword search tool below to find specific information within the annual report.-
 1
1 -
2
-
3
-
4
-
5
-
6
-
7
-
8
-
9
-
10
-
11
-
12
-
13
-
14
-
15
-
16
-
17
-
18
-
19
-
20
-
21
-
22
-
23
-
24
-
25
-
26
-
27
-
28
-
29
-
30
-
31
-
32
-
33
-
34
-
35
-
36
-
37
-
38
-
39
-
40
-
41
-
42
-
43
-
44
-
45
-
46
-
47
-
48
-
49
-
50
-
51
-
52
-
53
-
54
-
55
-
56
-
57
-
58
-
59
-
60
-
61
-
62
-
63
-
64
-
65
-
66
-
67
-
68
-
69
-
70
-
71
-
72
-
73
-
74
-
75
-
76
-
77
-
78
-
79
-
80
-
81
-
82
-
83
-
84
-
85
-
86
-
87
-
88
-
89
-
90
-
91
-
92
-
93
-
94
-
95
-
 96
96 -
 97
97 -
 98
98 -
 99
99 -
 100
100 -
 101
101 -
 102
102 -
 103
103 -
 104
104 -
 105
105 -
 106
106 -
 107
107 -
 108
108 -
 109
109 -
 110
110 -
 111
111 -
 112
112 -
 113
113 -
 114
114 -
 115
115 -
 116
116 -
117
-
118
-
119
-
120
-
121
-
122
-
123
-
124
-
125
-
126
-
127
-
128
-
129
-
130
-
131
-
132
-
133
-
134
-
135
-
136
-
137
-
138
-
139
-
140
-
141
-
142
-
143
-
144
-
145
-
146
-
147
-
148
-
149
-
150
-
151
-
152
-
153
-
154
-
155
-
156
-
157
-
158
-
159
-
160
-
161
-
162
-
163
-
164
-
165
-
166
-
167
-
168
-
169
-
170
-
171
-
172
-
173
-
174
-
175
-
176
-
177
-
178
-
179
-
180
-
181
-
182
-
183
-
184
-
185
-
186
-
187
-
188
-
189
-
190
-
191
-
192
-
193
-
194
-
195
-
196
-
197
-
198
-
199
-
200
-
201
-
202
-
203
-
204
-
205
-
206
-
207
-
208
-
209
-
210
-
211
-
212
-
213
-
214
-
215
-
216
-
217
-
218
-
219
-
220
-
221
-
222
-
223
-
224
-
225
-
226
-
227
-
228
-
229
-
230
-
231
-
232
-
233
-
234
-
235
-
236
-
237
-
238
-
239
-
240
-
241
-
242
-
243
-
244
-
245
-
246
-
247
-
248
-
249
-
250
-
251
-
252
-
253
-
254
-
255
-
256
-
257
-
258
-
259
-
260
-
261
-
262
-
263
-
264
-
265
-
266
-
267
-
268
-
269
-
270
-
271
-
272
-
273
 |
 |
185.3
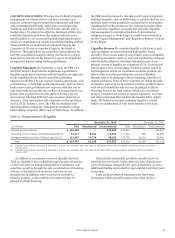
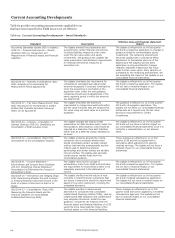
Capital Management (continued)
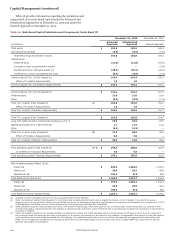
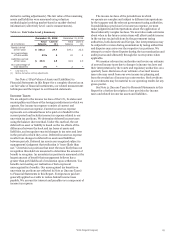
Table 56 provides information regarding the calculation and
composition of our risk-based capital under the Advanced and
Standardized Approaches at December 31, 2015 and under the
General Approach at December 31, 2014.
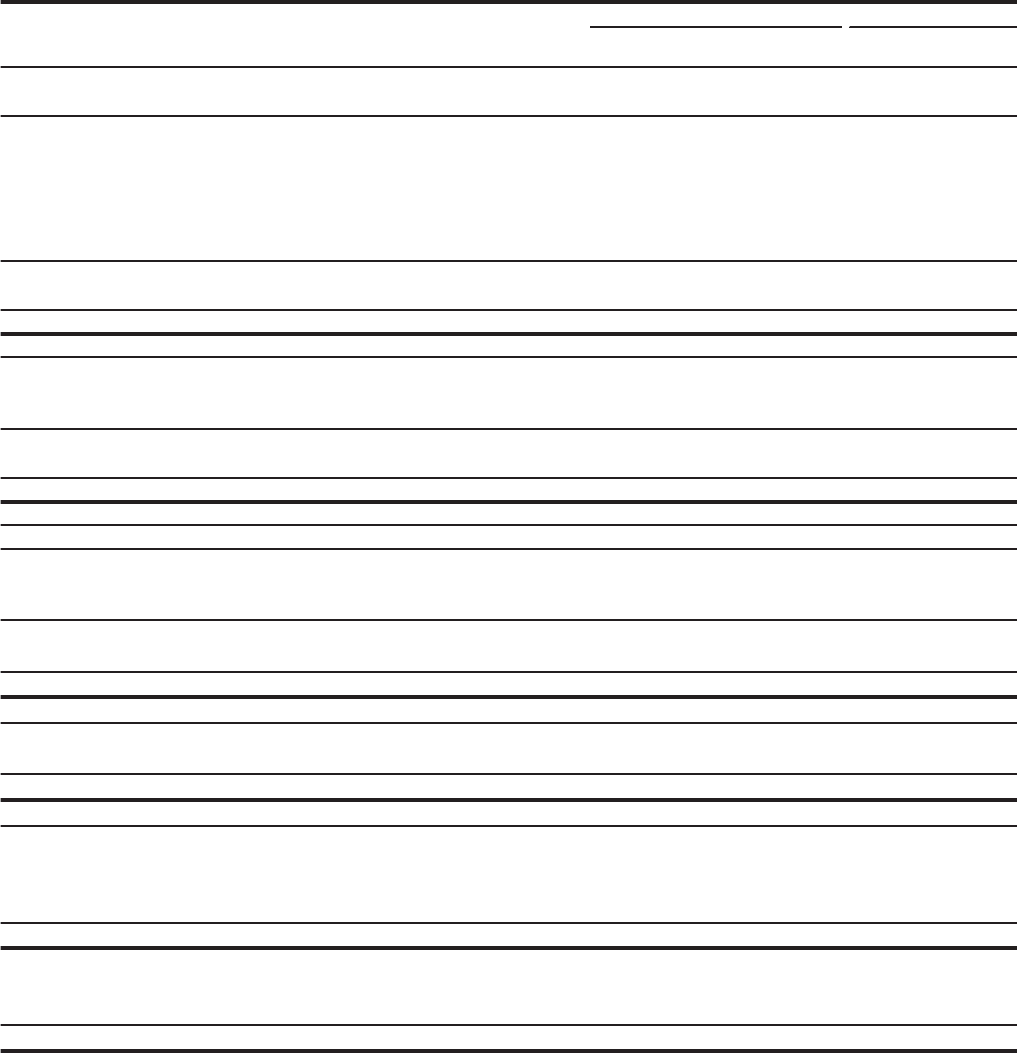
Table 56: Risk-Based Capital Calculation and Components Under Basel III
December 31, 2015 December 31, 2014
Advanced Standardized
(in billions) Approach Approach General Approach
Total equity $ 193.9 193.9
Noncontrolling interests (0.9) (0.9) (0.9)
Total Wells Fargo stockholders' equity 193.0 193.0 184.4
Adjustments:
Preferred stock (21.0) (21.0) (18.0)
Cumulative other comprehensive income — — (2.6)
Goodwill and other intangible assets (1) (28.7) (28.7) (26.3)
Investment in certain subsidiaries and other (0.9) (0.9) (0.4)
Common Equity Tier 1 (Fully Phased-In) 142.4 142.4 137.1
Effect of Transition Requirements 1.8 1.8 —
Common Equity Tier 1 (Transition Requirements) $ 144.2 144.2 137.1
Common Equity Tier 1 (Fully Phased-In) $ 142.4 142.4 137.1
Preferred stock 21.0 21.0 18.0
Other (0.6) (0.6) (0.4)
Total Tier 1 capital (Fully Phased-In) (A) 162.8 162.8 154.7
Effect of Transition Requirements 1.8 1.8 —
Total Tier 1 capital (Transition Requirements) $ 164.6 164.6 154.7
Total Tier 1 capital (Fully Phased-In) $ 162.8 162.8
Long-term debt and other instruments qualifying as Tier 2 25.8 25.8 25.0
Qualifying allowance for credit losses (2) 2.1 12.5 13.2
Other (0.3) (0.3) —
Total Tier 2 capital (Fully Phased-In) (B) 27.6 38.0 38.2
Effect of Transition Requirements 3.0 3.0 —
Total Tier 2 capital (Transition Requirements) $ 30.6 41.0 38.2
Total qualifying capital (Fully Phased-In) (A+B) $ 190.4 200.8 192.9
Total Effect of Transition Requirements 4.8 4.8 —
Total qualifying capital (Transition Requirements) $ 195.2 205.6 192.9
Risk-Weighted Assets (RWAs) (3)(4):
Credit risk $ 989.6 1,284.8 1,192.9
Market risk 36.9 36.9 49.6
Operational risk 256.3 N/A N/A
Total RWAs (Fully Phased-In) $ 1,282.8 1,321.7 1,242.5
Credit risk $ 970.0 1,266.2 1,192.9
Market risk 36.9 36.9 49.6
Operational risk 256.3 N/A N/A
Total RWAs (Transition Requirements) $ 1,263.2 1,303.1 1,242.5
(1) Goodwill and other intangible assets are net of any associated deferred tax liabilities.
(2) Under the Advanced Approach the allowance for credit losses that exceeds expected credit losses is eligible for inclusion in Tier 2 Capital, to the extent the excess
allowance does not exceed 0.6% of Advanced credit RWAs, and under the Standardized Approach, the allowance for credit losses is includable in Tier 2 Capital up to 1.25%
of Standardized credit RWAs, with any excess allowance for credit losses being deducted from total RWAs.
(3) RWAs calculated under the Advanced Approach utilize a risk-sensitive methodology, which relies upon the use of internal credit models based upon our experience with
internal rating grades. Advanced Approach also includes an operational risk component, which reflects the risk of operating loss resulting from inadequate or failed internal
processes or systems.
(4) Under the regulatory guidelines for risk-based capital, on-balance sheet assets and credit equivalent amounts of derivatives and off-balance sheet items are assigned to
one of several broad risk categories according to the obligor, or, if relevant, the guarantor or the nature of any collateral. The aggregate dollar amount in each risk category
is then multiplied by the risk weight associated with that category. The resulting weighted values from each of the risk categories are aggregated for determining total
RWAs. The risk weights and categories were changed by Basel III for the Standardized Approach and will generally result in higher RWAs than result from the General
Approach risk weights and categories.
Wells Fargo & Company
154.7
104