Wells Fargo 2015 Annual Report Download - page 137
Download and view the complete annual report
Please find page 137 of the 2015 Wells Fargo annual report below. You can navigate through the pages in the report by either clicking on the pages listed below, or by using the keyword search tool below to find specific information within the annual report.-
 1
1 -
2
-
3
-
4
-
5
-
6
-
7
-
8
-
9
-
10
-
11
-
12
-
13
-
14
-
15
-
16
-
17
-
18
-
19
-
20
-
21
-
22
-
23
-
24
-
25
-
26
-
27
-
28
-
29
-
30
-
31
-
32
-
33
-
34
-
35
-
36
-
37
-
38
-
39
-
40
-
41
-
42
-
43
-
44
-
45
-
46
-
47
-
48
-
49
-
50
-
51
-
52
-
53
-
54
-
55
-
56
-
57
-
58
-
59
-
60
-
61
-
62
-
63
-
64
-
65
-
66
-
67
-
68
-
69
-
70
-
71
-
72
-
73
-
74
-
75
-
76
-
77
-
78
-
79
-
80
-
81
-
82
-
83
-
84
-
85
-
86
-
87
-
88
-
89
-
90
-
91
-
92
-
93
-
94
-
95
-
96
-
97
-
98
-
99
-
100
-
101
-
102
-
103
-
104
-
105
-
106
-
107
-
108
-
109
-
110
-
111
-
112
-
113
-
114
-
115
-
116
-
117
-
118
-
119
-
120
-
121
-
122
-
123
-
124
-
125
-
126
-
 127
127 -
 128
128 -
 129
129 -
 130
130 -
 131
131 -
 132
132 -
 133
133 -
 134
134 -
 135
135 -
 136
136 -
 137
137 -
 138
138 -
 139
139 -
 140
140 -
 141
141 -
 142
142 -
 143
143 -
 144
144 -
 145
145 -
 146
146 -
 147
147 -
148
-
149
-
150
-
151
-
152
-
153
-
154
-
155
-
156
-
157
-
158
-
159
-
160
-
161
-
162
-
163
-
164
-
165
-
166
-
167
-
168
-
169
-
170
-
171
-
172
-
173
-
174
-
175
-
176
-
177
-
178
-
179
-
180
-
181
-
182
-
183
-
184
-
185
-
186
-
187
-
188
-
189
-
190
-
191
-
192
-
193
-
194
-
195
-
196
-
197
-
198
-
199
-
200
-
201
-
202
-
203
-
204
-
205
-
206
-
207
-
208
-
209
-
210
-
211
-
212
-
213
-
214
-
215
-
216
-
217
-
218
-
219
-
220
-
221
-
222
-
223
-
224
-
225
-
226
-
227
-
228
-
229
-
230
-
231
-
232
-
233
-
234
-
235
-
236
-
237
-
238
-
239
-
240
-
241
-
242
-
243
-
244
-
245
-
246
-
247
-
248
-
249
-
250
-
251
-
252
-
253
-
254
-
255
-
256
-
257
-
258
-
259
-
260
-
261
-
262
-
263
-
264
-
265
-
266
-
267
-
268
-
269
-
270
-
271
-
272
-
273
 |
 |

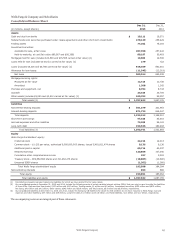
Wells Fargo & Company and Subsidiaries
Consolidated Balance Sheet
Dec 31, Dec 31,
(in millions, except shares) 2015 2014
Assets
Cash and due from banks $ 19,111 19,571
Federal funds sold, securities purchased under resale agreements and other short-term investments 270,130 258,429
Trading assets 77,202 78,255
Investment securities:
Available-for-sale, at fair value 267,358 257,442
Held-to-maturity, at cost (fair value $80,567 and $56,359) 80,197 55,483
Mortgages held for sale (includes $13,539 and $15,565 carried at fair value) (1) 19,603 19,536
Loans held for sale (includes $0 and $1 carried at fair value) (1) 279 722
Loans (includes $5,316 and $5,788 carried at fair value) (1) 916,559 862,551
Allowance for loan losses (11,545) (12,319)
Net loans 905,014 850,232
Mortgage servicing rights:
Measured at fair value 12,415 12,738
Amortized 1,308 1,242
Premises and equipment, net 8,704 8,743
Goodwill 25,529 25,705
Other assets (includes $3,065 and $2,512 carried at fair value) (1) 100,782 99,057
Total assets (2) $ 1,787,632 1,687,155
Liabilities
Noninterest-bearing deposits $ 351,579 321,963
Interest-bearing deposits 871,733 846,347
Total deposits 1,223,312 1,168,310
Short-term borrowings 97,528 63,518
Accrued expenses and other liabilities 73,365 86,122
Long-term debt 199,536 183,943
Total liabilities (3) 1,593,741 1,501,893
Equity
Wells Fargo stockholders' equity:
Preferred stock 22,214 19,213
Common stock – $1-2/3 par value, authorized 9,000,000,000 shares; issued 5,481,811,474 shares 9,136 9,136
Additional paid-in capital 60,714 60,537
Retained earnings 120,866 107,040
Cumulative other comprehensive income 297 3,518
Treasury stock – 389,682,664 shares and 311,462,276 shares (18,867) (13,690)
Unearned ESOP shares (1,362) (1,360)
Total Wells Fargo stockholders' equity 192,998 184,394
Noncontrolling interests 893 868
Total equity 193,891 185,262
Total liabilities and equity $ 1,787,632 1,687,155
(1) Parenthetical amounts represent assets and liabilities for which we have elected the fair value option.
(2) Our consolidated assets at December 31, 2015 and 2014, include the following assets of certain variable interest entities (VIEs) that can only be used to settle the liabilities
of those VIEs: Cash and due from banks, $157 million and $117 million; Trading assets, $1 million and $0 million; Investment securities, $425 million and $875 million;
Net loans, $4.8 billion and $4.5 billion; Other assets, $242 million and $316 million; and Total assets, $5.6 billion and $5.8 billion, respectively.
(3) Our consolidated liabilities at December 31, 2015 and 2014, include the following VIE liabilities for which the VIE creditors do not have recourse to Wells Fargo: Accrued
expenses and other liabilities, $57 million and $49 million; Long-term debt, $1.3 billion and $1.6 billion; and Total liabilities, $1.4 billion and $1.7 billion, respectively.
The accompanying notes are an integral part of these statements.
Wells Fargo & Company
135