Wells Fargo 2015 Annual Report Download - page 260
Download and view the complete annual report
Please find page 260 of the 2015 Wells Fargo annual report below. You can navigate through the pages in the report by either clicking on the pages listed below, or by using the keyword search tool below to find specific information within the annual report.-
 1
1 -
2
-
3
-
4
-
5
-
6
-
7
-
8
-
9
-
10
-
11
-
12
-
13
-
14
-
15
-
16
-
17
-
18
-
19
-
20
-
21
-
22
-
23
-
24
-
25
-
26
-
27
-
28
-
29
-
30
-
31
-
32
-
33
-
34
-
35
-
36
-
37
-
38
-
39
-
40
-
41
-
42
-
43
-
44
-
45
-
46
-
47
-
48
-
49
-
50
-
51
-
52
-
53
-
54
-
55
-
56
-
57
-
58
-
59
-
60
-
61
-
62
-
63
-
64
-
65
-
66
-
67
-
68
-
69
-
70
-
71
-
72
-
73
-
74
-
75
-
76
-
77
-
78
-
79
-
80
-
81
-
82
-
83
-
84
-
85
-
86
-
87
-
88
-
89
-
90
-
91
-
92
-
93
-
94
-
95
-
96
-
97
-
98
-
99
-
100
-
101
-
102
-
103
-
104
-
105
-
106
-
107
-
108
-
109
-
110
-
111
-
112
-
113
-
114
-
115
-
116
-
117
-
118
-
119
-
120
-
121
-
122
-
123
-
124
-
125
-
126
-
127
-
128
-
129
-
130
-
131
-
132
-
133
-
134
-
135
-
136
-
137
-
138
-
139
-
140
-
141
-
142
-
143
-
144
-
145
-
146
-
147
-
148
-
149
-
150
-
151
-
152
-
153
-
154
-
155
-
156
-
157
-
158
-
159
-
160
-
161
-
162
-
163
-
164
-
165
-
166
-
167
-
168
-
169
-
170
-
171
-
172
-
173
-
174
-
175
-
176
-
177
-
178
-
179
-
180
-
181
-
182
-
183
-
184
-
185
-
186
-
187
-
188
-
189
-
190
-
191
-
192
-
193
-
194
-
195
-
196
-
197
-
198
-
199
-
200
-
201
-
202
-
203
-
204
-
205
-
206
-
207
-
208
-
209
-
210
-
211
-
212
-
213
-
214
-
215
-
216
-
217
-
218
-
219
-
220
-
221
-
222
-
223
-
224
-
225
-
226
-
227
-
228
-
229
-
230
-
231
-
232
-
233
-
234
-
235
-
236
-
237
-
238
-
239
-
240
-
241
-
242
-
243
-
244
-
245
-
246
-
247
-
248
-
249
-
 250
250 -
 251
251 -
 252
252 -
 253
253 -
 254
254 -
 255
255 -
 256
256 -
 257
257 -
 258
258 -
 259
259 -
 260
260 -
 261
261 -
 262
262 -
 263
263 -
 264
264 -
 265
265 -
 266
266 -
 267
267 -
 268
268 -
 269
269 -
 270
270 -
271
-
272
-
273
 |
 |

2015
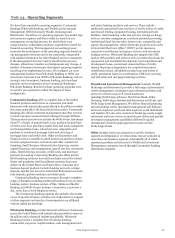
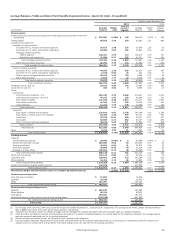
Note 24: Operating Segments (continued)
Table 24.1: Operating Segments
Wealth and
Community Wholesale Investment Consolidated
(income/expense in millions, average balances in billions) Banking Banking Management Other (1) Company
Net interest income (2) $ 29,242 $ 14,350 $ 3,478 $ (1,769) $ 45,301
Provision (reversal of provision) for credit losses 2,427 27 (25) 13 2,442
Noninterest income 20,099 11,554 12,299 (3,196) 40,756
Noninterest expense 26,981 14,116 12,067 (3,190) 49,974
Income (loss) before income tax expense (benefit) 19,933 11,761 3,735 (1,788) 33,641
Income tax expense (benefit) 6,202 3,424 1,420 (681) 10,365
Net income (loss) before noncontrolling interests 13,731 8,337 2,315 (1,107) 23,276
Less: Net income (loss) from noncontrolling interests 240 143 (1) — 382
Net income (loss) (3) $ 13,491 $ 8,194 $ 2,316 $ (1,107) $ 22,894
2014
Net interest income (2) $ 27,999 $ 14,073 $ 3,032 $ (1,577) $ 43,527
Provision (reversal of provision) for credit losses 1,796 (382) (50) 31 1,395
Noninterest income 20,159 11,325 12,237 (2,901) 40,820
Noninterest expense 26,290 13,831 11,993 (3,077) 49,037
Income (loss) before income tax expense (benefit) 20,072 11,949 3,326 (1,432) 33,915
Income tax expense (benefit) 6,049 3,540 1,262 (544) 10,307
Net income (loss) before noncontrolling interests 14,023 8,409 2,064 (888) 23,608
Less: Net income from noncontrolling interests 337 210 4 — 551
Net income (loss) (3) $ 13,686 $ 8,199 $ 2,060 $ (888) $ 23,057
2013
Net interest income (2) $ 27,123 $ 14,353 $ 2,797 $ (1,473) $ 42,800
Provision (reversal of provision) for credit losses 2,841 (521) (16) 5 2,309
Noninterest income 20,556 11,494 11,533 (2,603) 40,980
Noninterest expense 27,090 13,077 11,486 (2,811) 48,842
Income (loss) before income tax expense (benefit) 17,748 13,291 2,860 (1,270) 32,629
Income tax expense (benefit) 5,442 4,364 1,082 (483) 10,405
Net income (loss) before noncontrolling interests 12,306 8,927 1,778 (787) 22,224
Less: Net income from noncontrolling interests 159 175 12 — 346
Net income (loss) (3) $ 12,147 $ 8,752 $ 1,766 $ (787) $ 21,878
2015
Average loans $ 475.9 397.3 60.1 (47.9) 885.4
Average assets 910.0 724.9 192.8 (84.8) 1,742.9
Average deposits 654.4 438.9 172.3 (71.5) 1,194.1
2014
Average loans 468.8 355.6 52.1 (42.1) 834.4
Average assets 853.2 636.5 186.1 (82.5) 1,593.3
Average deposits 614.3 404.0 163.5 (67.7) 1,114.1
(1) Includes items not specific to a business segment and the elimination of certain items that are included in more than one business segment, substantially all of which
represents products and services for Wealth and Investment Management customers served through Community Banking distribution channels.
(2) Net interest income is the difference between interest earned on assets and the cost of liabilities to fund those assets. Interest earned includes actual interest earned on
segment assets and, if the segment has excess liabilities, interest credits for providing funding to other segments. The cost of liabilities includes interest expense on
segment liabilities and, if the segment does not have enough liabilities to fund its assets, a funding charge based on the cost of excess liabilities from another segment.
(3) Represents segment net income (loss) for Community Banking; Wholesale Banking; and Wealth and Investment Management segments and Wells Fargo net income for the
consolidated company.
Wells Fargo & Company
258