Wells Fargo 2015 Annual Report Download - page 269
Download and view the complete annual report
Please find page 269 of the 2015 Wells Fargo annual report below. You can navigate through the pages in the report by either clicking on the pages listed below, or by using the keyword search tool below to find specific information within the annual report.-
 1
1 -
2
-
3
-
4
-
5
-
6
-
7
-
8
-
9
-
10
-
11
-
12
-
13
-
14
-
15
-
16
-
17
-
18
-
19
-
20
-
21
-
22
-
23
-
24
-
25
-
26
-
27
-
28
-
29
-
30
-
31
-
32
-
33
-
34
-
35
-
36
-
37
-
38
-
39
-
40
-
41
-
42
-
43
-
44
-
45
-
46
-
47
-
48
-
49
-
50
-
51
-
52
-
53
-
54
-
55
-
56
-
57
-
58
-
59
-
60
-
61
-
62
-
63
-
64
-
65
-
66
-
67
-
68
-
69
-
70
-
71
-
72
-
73
-
74
-
75
-
76
-
77
-
78
-
79
-
80
-
81
-
82
-
83
-
84
-
85
-
86
-
87
-
88
-
89
-
90
-
91
-
92
-
93
-
94
-
95
-
96
-
97
-
98
-
99
-
100
-
101
-
102
-
103
-
104
-
105
-
106
-
107
-
108
-
109
-
110
-
111
-
112
-
113
-
114
-
115
-
116
-
117
-
118
-
119
-
120
-
121
-
122
-
123
-
124
-
125
-
126
-
127
-
128
-
129
-
130
-
131
-
132
-
133
-
134
-
135
-
136
-
137
-
138
-
139
-
140
-
141
-
142
-
143
-
144
-
145
-
146
-
147
-
148
-
149
-
150
-
151
-
152
-
153
-
154
-
155
-
156
-
157
-
158
-
159
-
160
-
161
-
162
-
163
-
164
-
165
-
166
-
167
-
168
-
169
-
170
-
171
-
172
-
173
-
174
-
175
-
176
-
177
-
178
-
179
-
180
-
181
-
182
-
183
-
184
-
185
-
186
-
187
-
188
-
189
-
190
-
191
-
192
-
193
-
194
-
195
-
196
-
197
-
198
-
199
-
200
-
201
-
202
-
203
-
204
-
205
-
206
-
207
-
208
-
209
-
210
-
211
-
212
-
213
-
214
-
215
-
216
-
217
-
218
-
219
-
220
-
221
-
222
-
223
-
224
-
225
-
226
-
227
-
228
-
229
-
230
-
231
-
232
-
233
-
234
-
235
-
236
-
237
-
238
-
239
-
240
-
241
-
242
-
243
-
244
-
245
-
246
-
247
-
248
-
249
-
250
-
251
-
252
-
253
-
254
-
255
-
256
-
257
-
258
-
 259
259 -
 260
260 -
 261
261 -
 262
262 -
 263
263 -
 264
264 -
 265
265 -
 266
266 -
 267
267 -
 268
268 -
 269
269 -
 270
270 -
 271
271 -
 272
272 -
 273
273
 |
 |
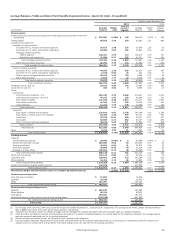
our core loan portfolios increased $62.8 billion from the prior
year. Our core loan portfolio growth included $11.5 billion from
the GE Capital commercial real estate loan purchase and related
financing transaction announced in first quarter 2015. We grew
our investment securities portfolio by $34.6 billion in 2015 and
our federal funds sold, securities purchased under resale
agreements and other short-term investments (collectively
referred to as federal funds sold and other short-term
investments elsewhere in this Report) increased by $11.7 billion,
or 5%, during the year. While we believe our liquidity position
continued to remain strong with increased regulatory
expectations, we have added to our position over the past year.
The strength of our balance sheet during 2015 positioned us
for the agreement we announced in third quarter 2015 to
purchase GE Capital's Commercial Distribution Finance and
Vendor Finance businesses as well as a portion of its Corporate
Finance business – an acquisition that will help us serve more
markets and meet more of our customers' financial needs. The
acquisition is expected to include total assets of approximately
$31 billion and is expected to close in two phases. The North
American portion, which represents approximately 90% of total
assets to be acquired, is expected to close late in first quarter
2016. The international portion is expected to close in second
quarter 2016. Also, in January 2016 we closed our purchase of
GE Railcar Services, which included $4.0 billion of operating
and capital leases, comprised of 77,000 railcars and just over
1,000 locomotives that were added to our existing First Union
Rail business. During fourth quarter 2015 we issued long-term
debt to partially fund the anticipated closing of these GE Capital
acquisitions.
Deposit growth remained strong with period-end deposits
up $55.0 billion from 2014. This increase reflected solid growth
across both our commercial and consumer businesses. We grew
our primary consumer checking customers by 5.6% and primary
small business and business banking checking customers by
4.8% from a year ago (November 2015 compared with November
2014). Our ability to grow primary customers is important to our
results because these customers have more interactions with us
and are significantly more profitable than non-primary
customers.
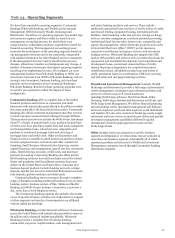
Credit Quality
Credit quality remained strong in 2015, demonstrating the
benefit of our diversified loan portfolio. Solid performance in
several of our commercial and consumer loan portfolios was
evidenced by losses remaining near historically low levels,
reflecting our long-term risk focus. Net charge-offs of
$2.9 billion were 0.33% of average loans, down 2 basis points
from a year ago. Net losses in our commercial portfolio were
$387 million, or 9 basis points of average loans. Net consumer
losses declined to 55 basis points in 2015 from 65 basis points in
2014. Our commercial real estate portfolios were in a net
recovery position for each quarter of the last three years,
reflecting our conservative risk discipline and improved market
conditions. Losses on our consumer real estate portfolios
declined $497 million, or 44%, from a year ago. The consumer
loss levels reflected the benefit of the improving housing market
and our continued focus on originating high quality loans.
Approximately 67% of the consumer first mortgage portfolio was
originated after 2008, when new underwriting standards were
implemented.
Our provision for credit losses in 2015 was $2.4 billion
compared with $1.4 billion a year ago reflecting a release of
$450 million from the allowance for credit losses, compared with
a release of $1.6 billion a year ago. We did not release or build
our allowance in the last half of 2015 as the credit improvement
in our residential real estate portfolios was offset by higher
commercial allowance reflecting deterioration in our oil and gas
portfolio. Total loans in the oil and gas portfolio were down 6%
from a year ago and are now less than 2% of our total loans
outstanding. Approximately $1.2 billion of the allowance at
December 31, 2015 was allocated to our oil and gas portfolio;
however the entire allowance is available to absorb credit losses
inherent in the total loan portfolio. If oil prices remain low for a
prolonged period of time, there could be additional performance
deterioration in our oil and gas portfolio resulting in higher
criticized assets, nonperforming loans, allowance levels and
ultimately credit losses. Deteriorated performance can take the
form of increased downgrades, borrower defaults, potentially
higher commitment drawdowns prior to default, and
downgraded borrowers being unable to fully access the capital
markets. Furthermore, our loan exposure in communities where
the employment base has a concentration in the oil and gas
sector may experience some credit challenges.
Future allowance levels may increase or decrease based on a
variety of factors, including loan growth, portfolio performance
and general economic conditions.
In addition to lower net charge-offs, nonperforming assets
(NPAs) through the end of 2015 have declined for 13 consecutive
quarters and were down $2.7 billion, or 17%, from 2014.
Nonaccrual loans declined $1.5 billion from the prior year while
foreclosed assets were down $1.2 billion from 2014.
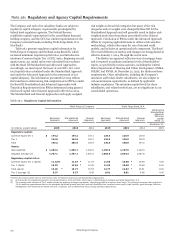
Capital
Our capital levels remained strong in 2015, even as we returned
more capital to our shareholders, with total equity increasing to
$193.9 billion at December 31, 2015, up $8.6 billion from the
prior year. We returned $12.6 billion to shareholders in 2015
($12.5 billion in 2014) through common stock dividends and net
share repurchases and our net payout ratio (which is the ratio of
(i) common stock dividends and share repurchases less
issuances and stock compensation-related items, divided by (ii)
net income applicable to common stock) was 59%. During 2015
we increased our quarterly common stock dividend by 7% to
$0.375 per share. In 2015, our common shares outstanding
declined by 78.2 million shares as we continued to reduce our
common share count through the repurchase of 163.4 million
common shares during the year. We also entered into a
$500 million forward repurchase contract with an unrelated
third party in December 2015 that settled in January 2016 for
9.2 million shares. In addition, we entered into a $750 million
forward repurchase contract with an unrelated third party in
January 2016 that settled in first quarter 2016 for 15.9 million
shares. We expect our share count to continue to decline in 2016
as a result of anticipated net share repurchases.
We believe an important measure of our capital strength is
the Common Equity Tier 1 ratio on a fully phased-in basis, which
increased to 10.77% in 2015 from 10.43% a year ago. Likewise,
our other regulatory capital ratios remained strong. See the
“Capital Management” section in this Report for more
information regarding our capital, including the calculation of
our regulatory capital amounts.
31
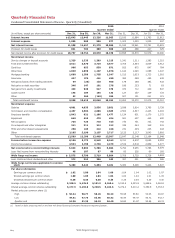
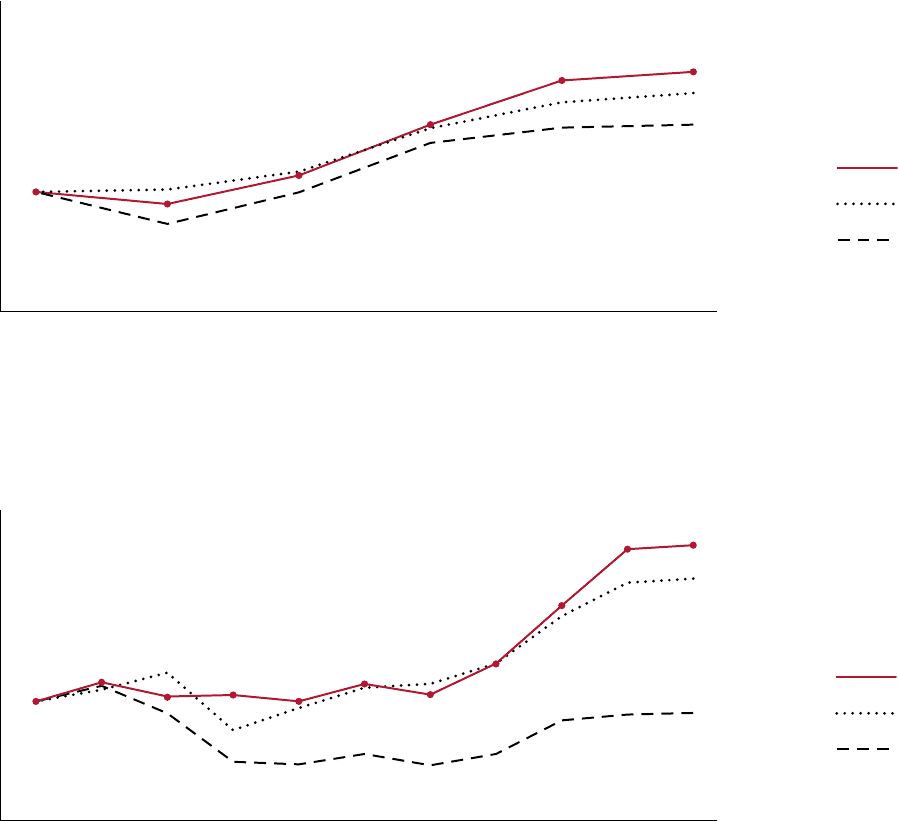
Stock Performance
These graphs compare the cumulative total stockholder return and total compound annual growth rate
(CAGR) for our common stock (NYSE: WFC) for the five- and ten-year periods ended December 31, 2015,
with the cumulative total stockholder returns for the same periods for the Keefe, Bruyette and Woods (KBW)
Total Return Bank Index (KBW Nasdaq Bank Index (BKX)) and the S&P 500 Index.
The cumulative total stockholder returns (including reinvested dividends) in the graphs assume the
investment of $100 in Wells Fargo’s common stock, the KBW Nasdaq Bank Index and the S&P 500 Index.
Five Year Performance Graph
Wells Fargo
(WFC)
S&P 500
KBW Nasdaq
Bank Index
$ 80
$140
$120
$100
$ 60
$ 40
$ 20
$160
$180
$200
$220
$240
2010 2011 2012 2013 2014 2015 5-year
CAGR
$100 $91 $115 $158 $195 $199 15% Wells Fargo
100 102 118 157 178 181 13% S&P 500
100 77 102 141 154 155 9% KBW Nasdaq
Bank Index
Ten Year Performance Graph
Wells Fargo
(WFC)
S&P 500
KBW Nasdaq
Bank Index
$ 80
$140
$120
$100
$ 60
$ 40
$ 20
$160
$180
$200
$220
$240
2005 2006 2007 2008 2009 2010 2011 2012 2013 2014 2015 10-year
CAGR
$100 $117 $103 $105 $100 $115 $104 $133 $182 $226 $230 9% Wells Fargo
100 116 122 77 97 112 114 133 176 200 203 7% S&P 500
100 117 91 48 47 58 45 59 82 89 90 (1)% KBW Nasdaq
Bank Index
Wells Fargo & Company
267