Wells Fargo 2015 Annual Report Download - page 142
Download and view the complete annual report
Please find page 142 of the 2015 Wells Fargo annual report below. You can navigate through the pages in the report by either clicking on the pages listed below, or by using the keyword search tool below to find specific information within the annual report.-
 1
1 -
2
-
3
-
4
-
5
-
6
-
7
-
8
-
9
-
10
-
11
-
12
-
13
-
14
-
15
-
16
-
17
-
18
-
19
-
20
-
21
-
22
-
23
-
24
-
25
-
26
-
27
-
28
-
29
-
30
-
31
-
32
-
33
-
34
-
35
-
36
-
37
-
38
-
39
-
40
-
41
-
42
-
43
-
44
-
45
-
46
-
47
-
48
-
49
-
50
-
51
-
52
-
53
-
54
-
55
-
56
-
57
-
58
-
59
-
60
-
61
-
62
-
63
-
64
-
65
-
66
-
67
-
68
-
69
-
70
-
71
-
72
-
73
-
74
-
75
-
76
-
77
-
78
-
79
-
80
-
81
-
82
-
83
-
84
-
85
-
86
-
87
-
88
-
89
-
90
-
91
-
92
-
93
-
94
-
95
-
96
-
97
-
98
-
99
-
100
-
101
-
102
-
103
-
104
-
105
-
106
-
107
-
108
-
109
-
110
-
111
-
112
-
113
-
114
-
115
-
116
-
117
-
118
-
119
-
120
-
121
-
122
-
123
-
124
-
125
-
126
-
127
-
128
-
129
-
130
-
131
-
 132
132 -
 133
133 -
 134
134 -
 135
135 -
 136
136 -
 137
137 -
 138
138 -
 139
139 -
 140
140 -
 141
141 -
 142
142 -
 143
143 -
 144
144 -
 145
145 -
 146
146 -
 147
147 -
 148
148 -
 149
149 -
 150
150 -
 151
151 -
 152
152 -
153
-
154
-
155
-
156
-
157
-
158
-
159
-
160
-
161
-
162
-
163
-
164
-
165
-
166
-
167
-
168
-
169
-
170
-
171
-
172
-
173
-
174
-
175
-
176
-
177
-
178
-
179
-
180
-
181
-
182
-
183
-
184
-
185
-
186
-
187
-
188
-
189
-
190
-
191
-
192
-
193
-
194
-
195
-
196
-
197
-
198
-
199
-
200
-
201
-
202
-
203
-
204
-
205
-
206
-
207
-
208
-
209
-
210
-
211
-
212
-
213
-
214
-
215
-
216
-
217
-
218
-
219
-
220
-
221
-
222
-
223
-
224
-
225
-
226
-
227
-
228
-
229
-
230
-
231
-
232
-
233
-
234
-
235
-
236
-
237
-
238
-
239
-
240
-
241
-
242
-
243
-
244
-
245
-
246
-
247
-
248
-
249
-
250
-
251
-
252
-
253
-
254
-
255
-
256
-
257
-
258
-
259
-
260
-
261
-
262
-
263
-
264
-
265
-
266
-
267
-
268
-
269
-
270
-
271
-
272
-
273
 |
 |

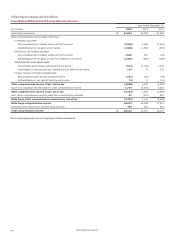
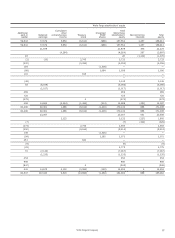
Wells Fargo & Company and Subsidiaries
Consolidated Statement of Cash Flows
Year ended December 31,
(in millions) 2015 2014 2013
Cash flows from operating activities:
Net income before noncontrolling interests $ 23,276 23,608 22,224
Adjustments to reconcile net income to net cash provided by operating activities:
Provision for credit losses 2,442 1,395 2,309
Changes in fair value of MSRs, MHFS and LHFS carried at fair value 62 1,820 (3,229)
Depreciation, amortization and accretion 3,288 2,515 3,293
Other net gains (6,496) (3,760) (9,384)
Stock-based compensation 1,958 1,912 1,920
Excess tax benefits related to stock incentive compensation (453) (453) (271)
Originations of MHFS (178,266) (144,812) (317,054)
Proceeds from sales of and principal collected on mortgages originated for sale 133,194 117,097 311,431
Proceeds from sales of and principal collected on LHFS 7 207 575
Purchases of LHFS (28) (154) (291)
Net change in:
Trading assets 47,244 11,186 43,638
Deferred income taxes (2,265) 2,354 4,977
Accrued interest receivable (623) (372) (13)
Accrued interest payable 160 119 (32)
Other assets (1,764) (10,681) 4,693
Other accrued expenses and liabilities (6,964) 15,548 (7,145)
Net cash provided by operating activities 14,772 17,529 57,641
Cash flows from investing activities:
Net change in:
Federal funds sold, securities purchased under resale agreements and other short-term investments (11,866) (41,778) (78,184)
Available-for-sale securities:
Sales proceeds 25,431 6,089 2,837
Prepayments and maturities 33,912 37,257 50,737
Purchases (79,778) (44,807) (89,474)
Held-to-maturity securities:
Paydowns and maturities 5,290 5,168 30
Purchases (25,424) (47,012) (5,782)
Nonmarketable equity investments:
Sales proceeds 3,496 3,161 2,577
Purchases (2,352) (3,087) (3,273)
Loans:
Loans originated by banking subsidiaries, net of principal collected (57,016) (65,162) (43,744)
Proceeds from sales (including participations) of loans held for investment 11,672 21,564 7,694
Purchases (including participations) of loans (13,759) (6,424) (11,563)
Principal collected on nonbank entities' loans 10,023 13,589 19,955
Loans originated by nonbank entities (12,441) (13,570) (17,311)
Net cash paid for acquisitions (3) (174) —
Proceeds from sales of foreclosed assets and short sales 7,803 7,697 11,021
Net cash from purchases and sales of MSRs (135) (150) 407
Other, net (2,088) (741) 581
Net cash used by investing activities (107,235) (128,380) (153,492)
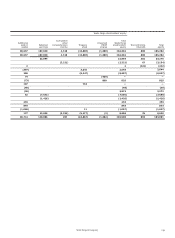
Cash flows from financing activities:
Net change in:
Deposits 54,867 89,133 76,342
Short-term borrowings 34,010 8,035 (3,390)
Long-term debt:
Proceeds from issuance 43,030 42,154 53,227
Repayment (27,333) (15,829) (25,423)
Preferred stock:
Proceeds from issuance 2,972 2,775 3,145
Cash dividends paid (1,426) (1,235) (1,017)
Common stock:
Proceeds from issuance 1,726 1,840 2,224
Repurchased (8,697) (9,414) (5,356)
Cash dividends paid (7,400) (6,908) (5,953)
Excess tax benefits related to stock incentive compensation 453 453 271
Net change in noncontrolling interests (232) (552) (296)
Other, net 33 51 136
Net cash provided by financing activities 92,003 110,503 93,910
Net change in cash and due from banks (460) (348) (1,941)
Cash and due from banks at beginning of year 19,571 19,919 21,860
Cash and due from banks at end of year $ 19,111 19,571 19,919
Supplemental cash flow disclosures:
Cash paid for interest $ 3,816 3,906 4,321
Cash paid for income taxes 13,688 8,808 7,132
The accompanying notes are an integral part of these statements. See Note 1 (Summary of Significant Accounting Policies) for noncash activities.
Wells Fargo & Company
140