Wells Fargo 2015 Annual Report Download - page 83
Download and view the complete annual report
Please find page 83 of the 2015 Wells Fargo annual report below. You can navigate through the pages in the report by either clicking on the pages listed below, or by using the keyword search tool below to find specific information within the annual report.-
 1
1 -
2
-
3
-
4
-
5
-
6
-
7
-
8
-
9
-
10
-
11
-
12
-
13
-
14
-
15
-
16
-
17
-
18
-
19
-
20
-
21
-
22
-
23
-
24
-
25
-
26
-
27
-
28
-
29
-
30
-
31
-
32
-
33
-
34
-
35
-
36
-
37
-
38
-
39
-
40
-
41
-
42
-
43
-
44
-
45
-
46
-
47
-
48
-
49
-
50
-
51
-
52
-
53
-
54
-
55
-
56
-
57
-
58
-
59
-
60
-
61
-
62
-
63
-
64
-
65
-
66
-
67
-
68
-
69
-
70
-
71
-
72
-
 73
73 -
 74
74 -
 75
75 -
 76
76 -
 77
77 -
 78
78 -
 79
79 -
 80
80 -
 81
81 -
 82
82 -
 83
83 -
 84
84 -
 85
85 -
 86
86 -
 87
87 -
 88
88 -
 89
89 -
 90
90 -
 91
91 -
 92
92 -
 93
93 -
94
-
95
-
96
-
97
-
98
-
99
-
100
-
101
-
102
-
103
-
104
-
105
-
106
-
107
-
108
-
109
-
110
-
111
-
112
-
113
-
114
-
115
-
116
-
117
-
118
-
119
-
120
-
121
-
122
-
123
-
124
-
125
-
126
-
127
-
128
-
129
-
130
-
131
-
132
-
133
-
134
-
135
-
136
-
137
-
138
-
139
-
140
-
141
-
142
-
143
-
144
-
145
-
146
-
147
-
148
-
149
-
150
-
151
-
152
-
153
-
154
-
155
-
156
-
157
-
158
-
159
-
160
-
161
-
162
-
163
-
164
-
165
-
166
-
167
-
168
-
169
-
170
-
171
-
172
-
173
-
174
-
175
-
176
-
177
-
178
-
179
-
180
-
181
-
182
-
183
-
184
-
185
-
186
-
187
-
188
-
189
-
190
-
191
-
192
-
193
-
194
-
195
-
196
-
197
-
198
-
199
-
200
-
201
-
202
-
203
-
204
-
205
-
206
-
207
-
208
-
209
-
210
-
211
-
212
-
213
-
214
-
215
-
216
-
217
-
218
-
219
-
220
-
221
-
222
-
223
-
224
-
225
-
226
-
227
-
228
-
229
-
230
-
231
-
232
-
233
-
234
-
235
-
236
-
237
-
238
-
239
-
240
-
241
-
242
-
243
-
244
-
245
-
246
-
247
-
248
-
249
-
250
-
251
-
252
-
253
-
254
-
255
-
256
-
257
-
258
-
259
-
260
-
261
-
262
-
263
-
264
-
265
-
266
-
267
-
268
-
269
-
270
-
271
-
272
-
273
 |
 |

has been modified, if the borrower has demonstrated
performance under the previous terms and the underwriting
process shows the capacity to continue to perform under the
restructured terms, the loan will generally remain in accruing
status. Otherwise, the loan will be placed in nonaccrual status
until the borrower demonstrates a sustained period of
performance, generally six consecutive months of payments, or
equivalent, inclusive of consecutive payments made prior to
modification. Loans will also be placed on nonaccrual, and a
corresponding charge-off is recorded to the loan balance, when
we believe that principal and interest contractually due under
the modified agreement will not be collectible.
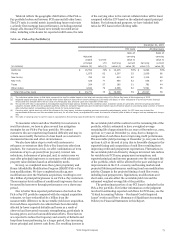
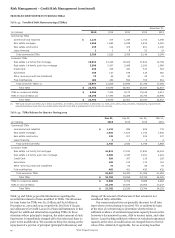
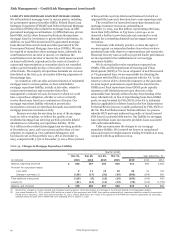
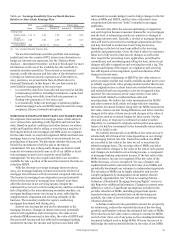
Table 35: Analysis of Changes in TDRs
Table 35 provides an analysis of the changes in TDRs. Loans
modified more than once are reported as TDR inflows only in the
period they are first modified. Other than resolutions such as
foreclosures, sales and transfers to held for sale, we may remove
loans held for investment from TDR classification, but only if
they have been refinanced or restructured at market terms and
qualify as a new loan.
Quarter ended
Dec 31, Sep 30, Jun 30, Mar 31, Year ended Dec. 31,
(in millions) 2015 2015 2015 2015 2015
Commercial TDRs
Balance, beginning of period $ 2,830 2,786 2,866 2,920 2,920 3,765
Inflows (1) 474 573 372 310 1,729 1,158
Outflows
Charge-offs (109) (86) (20) (26) (241) (155)
Foreclosure (64) (30) (5) (11) (110) (50)
Payments, sales and other (2) (426) (413) (427) (327) (1,593) (1,798)
Balance, end of period 2,705 2,830 2,786 2,866 2,705 2,920
Consumer TDRs
Balance, beginning of period 20,429 21,008 21,363 21,629 21,629 22,696
Inflows (1) 672 753 747 755 2,927 4,010
Outflows
Charge-offs (73) (79) (71) (88) (311) (515)
Foreclosure (226) (226) (242) (245) (939) (1,163)
Payments, sales and other (2) (786) (998) (807) (668) (3,259) (3,201)
Net change in trial modifications (3) (19) (29) 18 (20) (50) (198)
Balance, end of period 19,997 20,429 21,008 21,363 19,997 21,629
Total TDRs $ 22,702 23,259 23,794 24,229 22,702 24,549
(1) Inflows include loans that both modify and resolve within the period as well as advances on loans that modified in a prior period.
(2) Other outflows include normal amortization/accretion of loan basis adjustments and loans transferred to held-for-sale. It also includes $6 million of loans refinanced or
restructured at market terms and qualifying as new loans and removed from TDR classification for the quarter ended December 31, 2015, while no loans were removed
from TDR classification for the quarters ended September 30, June 30, and March 31, 2015. During 2014, $1 million of loans refinanced or structured as new loans and
were removed from TDR classification.
(3) Net change in trial modifications includes: inflows of new TDRs entering the trial payment period, net of outflows for modifications that either (i) successfully perform and
enter into a permanent modification, or (ii) did not successfully perform according to the terms of the trial period plan and are subsequently charged-off, foreclosed upon or
otherwise resolved. Our experience is that substantially all of the mortgages that enter a trial payment period program are successful in completing the program
requirements.
Wells Fargo & Company
2014
81