Wells Fargo 2015 Annual Report Download - page 76
Download and view the complete annual report
Please find page 76 of the 2015 Wells Fargo annual report below. You can navigate through the pages in the report by either clicking on the pages listed below, or by using the keyword search tool below to find specific information within the annual report.-
 1
1 -
2
-
3
-
4
-
5
-
6
-
7
-
8
-
9
-
10
-
11
-
12
-
13
-
14
-
15
-
16
-
17
-
18
-
19
-
20
-
21
-
22
-
23
-
24
-
25
-
26
-
27
-
28
-
29
-
30
-
31
-
32
-
33
-
34
-
35
-
36
-
37
-
38
-
39
-
40
-
41
-
42
-
43
-
44
-
45
-
46
-
47
-
48
-
49
-
50
-
51
-
52
-
53
-
54
-
55
-
56
-
57
-
58
-
59
-
60
-
61
-
62
-
63
-
64
-
65
-
 66
66 -
 67
67 -
 68
68 -
 69
69 -
 70
70 -
 71
71 -
 72
72 -
 73
73 -
 74
74 -
 75
75 -
 76
76 -
 77
77 -
 78
78 -
 79
79 -
 80
80 -
 81
81 -
 82
82 -
 83
83 -
 84
84 -
 85
85 -
 86
86 -
87
-
88
-
89
-
90
-
91
-
92
-
93
-
94
-
95
-
96
-
97
-
98
-
99
-
100
-
101
-
102
-
103
-
104
-
105
-
106
-
107
-
108
-
109
-
110
-
111
-
112
-
113
-
114
-
115
-
116
-
117
-
118
-
119
-
120
-
121
-
122
-
123
-
124
-
125
-
126
-
127
-
128
-
129
-
130
-
131
-
132
-
133
-
134
-
135
-
136
-
137
-
138
-
139
-
140
-
141
-
142
-
143
-
144
-
145
-
146
-
147
-
148
-
149
-
150
-
151
-
152
-
153
-
154
-
155
-
156
-
157
-
158
-
159
-
160
-
161
-
162
-
163
-
164
-
165
-
166
-
167
-
168
-
169
-
170
-
171
-
172
-
173
-
174
-
175
-
176
-
177
-
178
-
179
-
180
-
181
-
182
-
183
-
184
-
185
-
186
-
187
-
188
-
189
-
190
-
191
-
192
-
193
-
194
-
195
-
196
-
197
-
198
-
199
-
200
-
201
-
202
-
203
-
204
-
205
-
206
-
207
-
208
-
209
-
210
-
211
-
212
-
213
-
214
-
215
-
216
-
217
-
218
-
219
-
220
-
221
-
222
-
223
-
224
-
225
-
226
-
227
-
228
-
229
-
230
-
231
-
232
-
233
-
234
-
235
-
236
-
237
-
238
-
239
-
240
-
241
-
242
-
243
-
244
-
245
-
246
-
247
-
248
-
249
-
250
-
251
-
252
-
253
-
254
-
255
-
256
-
257
-
258
-
259
-
260
-
261
-
262
-
263
-
264
-
265
-
266
-
267
-
268
-
269
-
270
-
271
-
272
-
273
 |
 |

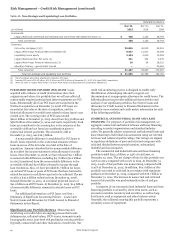
Risk Management – Credit Risk Management (continued)
Junior Lien Mortgage Portfolio The junior lien mortgage
portfolio consists of residential mortgage lines and loans that are
subordinate in rights to an existing lien on the same property. It
is not unusual for these lines and loans to have draw periods,
interest only payments, balloon payments, adjustable rates and
similar features. The majority of our junior lien loan products
are amortizing payment loans with fixed interest rates and
repayment periods between five to 30 years.
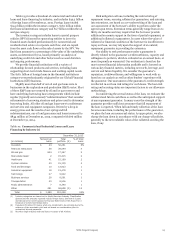
We continuously monitor the credit performance of our
junior lien mortgage portfolio for trends and factors that
influence the frequency and severity of loss. We have observed
that the severity of loss for junior lien mortgages is high and
generally not affected by whether we or a third party own or
service the related first lien mortgage, but the frequency of
delinquency is typically lower when we own or service the first
lien mortgage. In general, we have limited information available
on the delinquency status of the third party owned or serviced
senior lien where we also hold a junior lien. To capture this
inherent loss content, we use the experience of our junior lien
mortgages behind delinquent first liens that are owned or
serviced by us adjusted for any observed differences in
delinquency and loss rates associated with junior lien mortgages
behind third party first lien mortgages. We incorporate this
inherent loss content into our allowance for loan losses. Our
allowance process for junior liens considers the relative
difference in loss experience for junior liens behind first lien
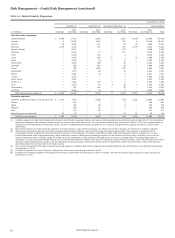
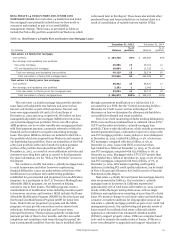
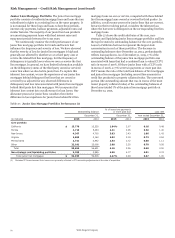
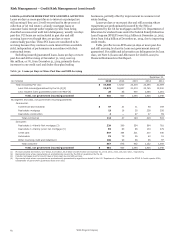
Table 27: Junior Lien Mortgage Portfolios Performance (1)
mortgage loans we own or service, compared with those behind
first lien mortgage loans owned or serviced by third parties. In
addition, our allowance process for junior liens that are current,
but are in their revolving period, considers the inherent loss
where the borrower is delinquent on the corresponding first lien
mortgage loans.
Table 27 shows the credit attributes of the core, non-
strategic and liquidating junior lien mortgage portfolios and lists
the top five states by outstanding balance for the core portfolio.
Loans to California borrowers represent the largest state
concentration in each of these portfolios. The decrease in
outstanding balances since December 31, 2014, predominantly
reflects loan paydowns. As of December 31, 2015, 17% of the
outstanding balance of the junior lien mortgage portfolio was
associated with loans that had a combined loan to value (CLTV)
ratio in excess of 100%. Of those junior liens with a CLTV ratio
in excess of 100%, 2.77% were two payments or more past due.
CLTV means the ratio of the total loan balance of first mortgages
and junior lien mortgages (including unused line amounts for
credit line products) to property collateral value. The unsecured
portion (the outstanding amount that was in excess of the most
recent property collateral value) of the outstanding balances of
these loans totaled 7% of the junior lien mortgage portfolio at
December 31, 2015.
Outstanding balance
% of loans two payments
or more past due Loss rate
December 31, December 31, Year ended December 31,
(in millions) 2015 2014 2015 2014 2015 2014
Core portfolio
California $ 13,776 15,535 1.94% 2.07 0.16 0.48
Florida 4,718 5,283 2.41 2.96 0.82 1.40
New Jersey 4,367 4,705 3.03 3.43 1.06 1.42
Virginia 2,889 3,160 2.02 2.18 0.73 0.84
Pennsylvania 2,721 2,942 2.33 2.72 0.88 1.11
Other 22,181 25,006 2.08 2.20 0.70 0.95
Total 50,652 56,631 2.16 2.36 0.60 0.90
Non-strategic and liquidating portfolios 2,283 2,985 4.56 4.77 2.01 2.74
Total junior lien mortgages $ 52,935 59,616 2.27% 2.49 0.67 1.00
(1) Excludes PCI loans because their losses were generally reflected in PCI accounting adjustments at the date of acquisition.
Wells Fargo & Company
74