MetLife 2008 Annual Report Download - page 99
Download and view the complete annual report
Please find page 99 of the 2008 MetLife annual report below. You can navigate through the pages in the report by either clicking on the pages listed below, or by using the keyword search tool below to find specific information within the annual report.-
 1
1 -
2
-
3
-
4
-
5
-
6
-
7
-
8
-
9
-
10
-
11
-
12
-
13
-
14
-
15
-
16
-
17
-
18
-
19
-
20
-
21
-
22
-
23
-
24
-
25
-
26
-
27
-
28
-
29
-
30
-
31
-
32
-
33
-
34
-
35
-
36
-
37
-
38
-
39
-
40
-
41
-
42
-
43
-
44
-
45
-
46
-
47
-
48
-
49
-
50
-
51
-
52
-
53
-
54
-
55
-
56
-
57
-
58
-
59
-
60
-
61
-
62
-
63
-
64
-
65
-
66
-
67
-
68
-
69
-
70
-
71
-
72
-
73
-
74
-
75
-
76
-
77
-
78
-
79
-
80
-
81
-
82
-
83
-
84
-
85
-
86
-
87
-
88
-
 89
89 -
 90
90 -
 91
91 -
 92
92 -
 93
93 -
 94
94 -
 95
95 -
 96
96 -
 97
97 -
 98
98 -
 99
99 -
 100
100 -
 101
101 -
 102
102 -
 103
103 -
 104
104 -
 105
105 -
 106
106 -
 107
107 -
 108
108 -
 109
109 -
110
-
111
-
112
-
113
-
114
-
115
-
116
-
117
-
118
-
119
-
120
-
121
-
122
-
123
-
124
-
125
-
126
-
127
-
128
-
129
-
130
-
131
-
132
-
133
-
134
-
135
-
136
-
137
-
138
-
139
-
140
-
141
-
142
-
143
-
144
-
145
-
146
-
147
-
148
-
149
-
150
-
151
-
152
-
153
-
154
-
155
-
156
-
157
-
158
-
159
-
160
-
161
-
162
-
163
-
164
-
165
-
166
-
167
-
168
-
169
-
170
-
171
-
172
-
173
-
174
-
175
-
176
-
177
-
178
-
179
-
180
-
181
-
182
-
183
-
184
-
185
-
186
-
187
-
188
-
189
-
190
-
191
-
192
-
193
-
194
-
195
-
196
-
197
-
198
-
199
-
200
-
201
-
202
-
203
-
204
-
205
-
206
-
207
-
208
-
209
-
210
-
211
-
212
-
213
-
214
-
215
-
216
-
217
-
218
-
219
-
220
-
221
-
222
-
223
-
224
-
225
-
226
-
227
-
228
-
229
-
230
-
231
-
232
-
233
-
234
-
235
-
236
-
237
-
238
-
239
-
240
 |
 |

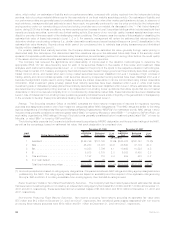
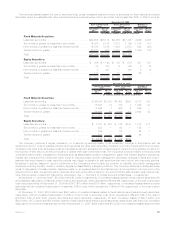
the same default methodology to all Alt-A bonds, regardless of the underlying collateral. The Company’s Alt-A portfolio has superior
structure to the overall Alt-A market. The Company’s Alt-A portfolio is 88% fixed rate collateral, has zero exposure to option ARM mortgages
and has only 12% hybrid ARMs. Fixed rate mortgages have performed better than both option ARMs and hybrid ARMs. Additionally, 83% of
the Company’s Alt-A portfolio has super senior credit enhancement, which typically provides double the credit enhancement of a standard
AAA rated bond. Based upon the analysis of the Company’s exposure to Alt-A mortgage loans through its investment in asset-backed
securities, the Company continues to expect to receive payments in accordance with the contractual terms of the securities.
Asset-Backed Securities. The Company’s asset-backed securities are diversified both by sector and by issuer. At December 31,
2008, the largest exposures in the Company’s asset-backed securities portfolio were credit card receivables, automobile receivables,
student loan receivables and residential mortgage-backed securities backed by sub-prime mortgage loans of 49%, 10%, 10% and 10% of
the total holdings, respectively. At December 31, 2008 and 2007, the Company’s holdings in asset-backed securities was $10.5 billion
and $10.6 billion at estimated fair value. At December 31, 2008 and 2007, $7.9 billion and $5.7 billion, respectively, or 75% and 54%,
respectively, of total asset-backed securities were rated Aaa/AAA by Moody’s, S&P or Fitch.
The Company’s asset-backed securities included in the structured securities table above include exposure to residential mortgage-
backed securities backed by sub-prime mortgage loans. Sub-prime mortgage lending is the origination of residential mortgage loans to
customers with weak credit profiles. The Company’s exposure exists through investment in asset-backed securities which are supported
by sub-prime mortgage loans. The slowing U.S. housing market, greater use of affordable mortgage products, and relaxed underwriting
standards for some originators of below-prime loans have recently led to higher delinquency and loss rates, especially within the 2006 and
2007 vintage year. Vintage year refers to the year of origination and not to the year of purchase. These factors have caused a pull-back in
market liquidity and repricing of risk, which has led to an increase in unrealized losses from December 31, 2007 to December 31, 2008.
Based upon the analysis of the Company’s exposure to sub-prime mortgage loans through its investment in asset-backed securities, the
Company expects to receive payments in accordance with the contractual terms of the securities.
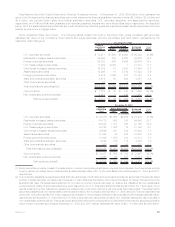
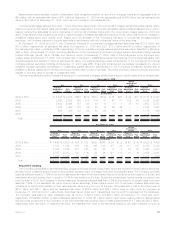
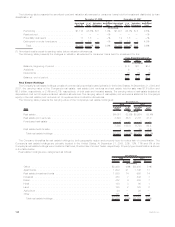
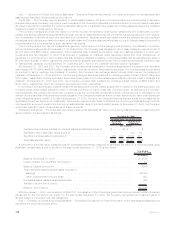
The following table shows the Company’s exposure to asset-backed securities supported by sub-prime mortgage loans by credit
quality and by vintage year:
Cost or
Amortized
Cost Fair
Value
Cost or
Amortized
Cost Fair
Value
Cost or
Amortized
Cost Fair
Value
Cost or
Amortized
Cost Fair
Value
Cost or
Amortized
Cost Fair
Value
Cost or
Amortized
Cost Fair
Value
Aaa Aa A Baa
Below
Investment
Grade Total
December 31, 2008
(In millions)
2003 & Prior . . . . . . . . . . . . . . . . . $ 96 $ 77 $ 92 $ 72 $ 26 $16 $ 83 $ 53 $ 8 $ 4 $ 305 $ 222
2004 . . . . . . . . . . . . . . . . . . . . . 129 70 372 204 5 3 37 28 2 1 545 306
2005 . . . . . . . . . . . . . . . . . . . . . 357 227 186 114 20 11 79 46 4 4 646 402
2006 . . . . . . . . . . . . . . . . . . . . . 146 106 69 30 15 10 26 7 2 2 258 155
2007 . . . . . . . . . . . . . . . . . . . . . — — 78 33 35 21 2 2 3 1 118 57
2008 . . . . . . . . . . . . . . . . . . . . . —————— ———— — —
Total .................... $728 $480 $797 $453 $101 $61 $227 $136 $19 $12 $1,872 $1,142
Cost or
Amortized
Cost Fair
Value
Cost or
Amortized
Cost Fair
Value
Cost or
Amortized
Cost Fair
Value
Cost or
Amortized
Cost Fair
Value
Cost or
Amortized
Cost Fair
Value
Cost or
Amortized
Cost Fair
Value
Aaa Aa A Baa
Below
Investment
Grade Total
December 31, 2007
(In millions)
2003 & Prior . . . . . . . . . . . . . . . . $ 217 $ 206 $130 $123 $15 $14 $13 $12 $ 4 $ 2 $ 379 $ 357
2004 . . . . . . . . . . . . . . . . . . . . 186 169 412 383 11 9 — — 1 — 610 561
2005 . . . . . . . . . . . . . . . . . . . . 509 462 218 197 — — — — — — 727 659
2006 . . . . . . . . . . . . . . . . . . . . 244 223 64 43 — — — — — — 308 266
2007 . . . . . . . . . . . . . . . . . . . . 132 123 17 9 — — — — — — 149 132
Total ................... $1,288 $1,183 $841 $755 $26 $23 $13 $12 $5 $2 $2,173 $1,975
At December 31, 2008 and 2007, the Company had asset-backed securities supported by sub-prime mortgage loans with estimated
fair values of $1.1 billion and $2.0 billion, respectively, and unrealized losses of $730 million and $198 million, respectively, as outlined in
the tables above. At December 31, 2008, approximately 82% of the portfolio is rated Aa or better of which 82% was in vintage year 2005
and prior. At December 31, 2007, approximately 98% of the portfolio was rated Aa or better of which 79% was in vintage year 2005 and
prior. These older vintages benefit from better underwriting, improved enhancement levels and higher residential property price appre-
ciation. At December 31, 2008, 37% of the asset-backed securities backed by sub-prime mortgage loans have been guaranteed by
financial guarantee insurers, of which 19% and 37% were guaranteed by financial guarantee insurers who were Aa and Baa rated,
respectively. At December 31, 2008, all of the $1.1 billion of asset-backed securities supported by sub-prime mortgage loans were
classified as Level 3 securities.
96 MetLife, Inc.