MetLife 2008 Annual Report Download - page 214
Download and view the complete annual report
Please find page 214 of the 2008 MetLife annual report below. You can navigate through the pages in the report by either clicking on the pages listed below, or by using the keyword search tool below to find specific information within the annual report.-
 1
1 -
2
-
3
-
4
-
5
-
6
-
7
-
8
-
9
-
10
-
11
-
12
-
13
-
14
-
15
-
16
-
17
-
18
-
19
-
20
-
21
-
22
-
23
-
24
-
25
-
26
-
27
-
28
-
29
-
30
-
31
-
32
-
33
-
34
-
35
-
36
-
37
-
38
-
39
-
40
-
41
-
42
-
43
-
44
-
45
-
46
-
47
-
48
-
49
-
50
-
51
-
52
-
53
-
54
-
55
-
56
-
57
-
58
-
59
-
60
-
61
-
62
-
63
-
64
-
65
-
66
-
67
-
68
-
69
-
70
-
71
-
72
-
73
-
74
-
75
-
76
-
77
-
78
-
79
-
80
-
81
-
82
-
83
-
84
-
85
-
86
-
87
-
88
-
89
-
90
-
91
-
92
-
93
-
94
-
95
-
96
-
97
-
98
-
99
-
100
-
101
-
102
-
103
-
104
-
105
-
106
-
107
-
108
-
109
-
110
-
111
-
112
-
113
-
114
-
115
-
116
-
117
-
118
-
119
-
120
-
121
-
122
-
123
-
124
-
125
-
126
-
127
-
128
-
129
-
130
-
131
-
132
-
133
-
134
-
135
-
136
-
137
-
138
-
139
-
140
-
141
-
142
-
143
-
144
-
145
-
146
-
147
-
148
-
149
-
150
-
151
-
152
-
153
-
154
-
155
-
156
-
157
-
158
-
159
-
160
-
161
-
162
-
163
-
164
-
165
-
166
-
167
-
168
-
169
-
170
-
171
-
172
-
173
-
174
-
175
-
176
-
177
-
178
-
179
-
180
-
181
-
182
-
183
-
184
-
185
-
186
-
187
-
188
-
189
-
190
-
191
-
192
-
193
-
194
-
195
-
196
-
197
-
198
-
199
-
200
-
201
-
202
-
203
-
 204
204 -
 205
205 -
 206
206 -
 207
207 -
 208
208 -
 209
209 -
 210
210 -
 211
211 -
 212
212 -
 213
213 -
 214
214 -
 215
215 -
 216
216 -
 217
217 -
 218
218 -
 219
219 -
 220
220 -
 221
221 -
 222
222 -
 223
223 -
 224
224 -
225
-
226
-
227
-
228
-
229
-
230
-
231
-
232
-
233
-
234
-
235
-
236
-
237
-
238
-
239
-
240
 |
 |

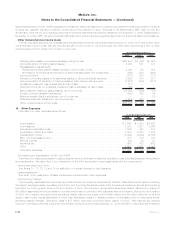
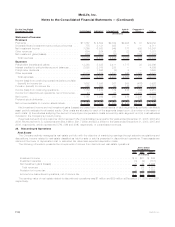
within Corporate & Other. Estimated restructuring costs may change as management continues to execute its restructuring plans.
Restructuring charges associated with this enterprise-wide initiative were as follows: Year Ended
December 31, 2008
(In millions)
Balanceasofbeginningoftheperiod............................................... $ —
Severancecharges ......................................................... 109
Changeinseverancechargeestimates ............................................ (8)
Cashpayments............................................................ (15)
Balanceasofendoftheperiod................................................... $ 86
Totalrestructuringchargesincurred ................................................ $101
Management anticipates further restructuring charges including severance, lease and asset impairments will be incurred during the
years ended December 31, 2009 and 2010. However, such restructuring plans are not sufficiently developed to enable the Company to
make an estimate of such restructuring charges at December 31, 2008.
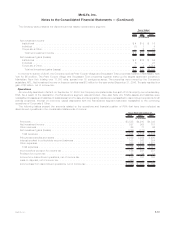
In addition to the restructuring charges incurred in connection with the aforementioned enterprise-wide initiative, the Company also
incurred severance costs in connection with the Argentine government’s nationalization of the its private pension business. The Company
recognized a restructuring charge of $15 million within the International segment during the fourth quarter of 2008 and made payments of
$12 million resulting in a restructuring liability of $3 million at December 31, 2008.
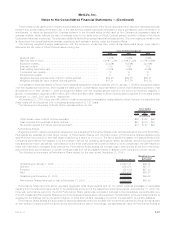
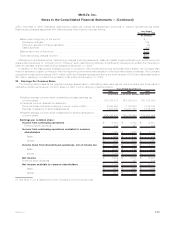
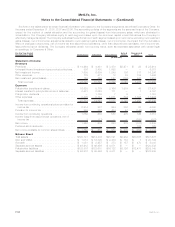
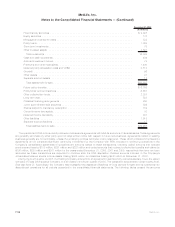
20. Earnings Per Common Share
The following table presents the weighted average shares used in calculating basic earnings per common share and those used in
calculating diluted earnings per common share for each income category presented below:
2008 2007 2006
Years Ended December 31,
(In millions, except share and per share data)
Weighted average common stock outstanding for basic earnings per
common share . . . . . . . . . . . . . . . . . . . . . . . . . . . . . . . . . . . . . . . 735,184,337 744,153,514 761,105,024
Incremental common shares from assumed:
Stock purchase contracts underlying common equity units(1) . . . . . . . . . 2,043,553 7,138,900 1,416,134
Exercise or issuance of stock-based awards . . . . . . . . . . . . . . . . . . . 7,557,540 10,971,585 8,182,938
Weighted average common stock outstanding for diluted earnings per
common share . . . . . . . . . . . . . . . . . . . . . . . . . . . . . . . . . . . . . . . 744,785,430 762,263,999 770,704,096
Earnings per common share:
Income from continuing operations ...................... $ 3,510 $ 4,102 $ 2,910
Preferredstockdividends .............................. 125 137 134
Income from continuing operations available to common
shareholders ..................................... $ 3,385 $ 3,965 $ 2,776
Basic.......................................... $ 4.60 $ 5.33 $ 3.65
Diluted ......................................... $ 4.54 $ 5.20 $ 3.60
Income (loss) from discontinued operations, net of income tax . . $ (301) $ 215 $ 3,383
Basic.......................................... $ (0.41) $ 0.29 $ 4.44
Diluted ......................................... $ (0.40) $ 0.28 $ 4.39
Net income ........................................ $ 3,209 $ 4,317 $ 6,293
Preferredstockdividends................................ 125 137 134
Net income available to common shareholders .............. $ 3,084 $ 4,180 $ 6,159
Basic.......................................... $ 4.19 $ 5.62 $ 8.09
Diluted ......................................... $ 4.14 $ 5.48 $ 7.99
(1) See Note 13 for a description of the Company’s common equity units.
F-91MetLife, Inc.
MetLife, Inc.
Notes to the Consolidated Financial Statements — (Continued)