MetLife 2008 Annual Report Download - page 94
Download and view the complete annual report
Please find page 94 of the 2008 MetLife annual report below. You can navigate through the pages in the report by either clicking on the pages listed below, or by using the keyword search tool below to find specific information within the annual report.-
 1
1 -
2
-
3
-
4
-
5
-
6
-
7
-
8
-
9
-
10
-
11
-
12
-
13
-
14
-
15
-
16
-
17
-
18
-
19
-
20
-
21
-
22
-
23
-
24
-
25
-
26
-
27
-
28
-
29
-
30
-
31
-
32
-
33
-
34
-
35
-
36
-
37
-
38
-
39
-
40
-
41
-
42
-
43
-
44
-
45
-
46
-
47
-
48
-
49
-
50
-
51
-
52
-
53
-
54
-
55
-
56
-
57
-
58
-
59
-
60
-
61
-
62
-
63
-
64
-
65
-
66
-
67
-
68
-
69
-
70
-
71
-
72
-
73
-
74
-
75
-
76
-
77
-
78
-
79
-
80
-
81
-
82
-
83
-
 84
84 -
 85
85 -
 86
86 -
 87
87 -
 88
88 -
 89
89 -
 90
90 -
 91
91 -
 92
92 -
 93
93 -
 94
94 -
 95
95 -
 96
96 -
 97
97 -
 98
98 -
 99
99 -
 100
100 -
 101
101 -
 102
102 -
 103
103 -
 104
104 -
105
-
106
-
107
-
108
-
109
-
110
-
111
-
112
-
113
-
114
-
115
-
116
-
117
-
118
-
119
-
120
-
121
-
122
-
123
-
124
-
125
-
126
-
127
-
128
-
129
-
130
-
131
-
132
-
133
-
134
-
135
-
136
-
137
-
138
-
139
-
140
-
141
-
142
-
143
-
144
-
145
-
146
-
147
-
148
-
149
-
150
-
151
-
152
-
153
-
154
-
155
-
156
-
157
-
158
-
159
-
160
-
161
-
162
-
163
-
164
-
165
-
166
-
167
-
168
-
169
-
170
-
171
-
172
-
173
-
174
-
175
-
176
-
177
-
178
-
179
-
180
-
181
-
182
-
183
-
184
-
185
-
186
-
187
-
188
-
189
-
190
-
191
-
192
-
193
-
194
-
195
-
196
-
197
-
198
-
199
-
200
-
201
-
202
-
203
-
204
-
205
-
206
-
207
-
208
-
209
-
210
-
211
-
212
-
213
-
214
-
215
-
216
-
217
-
218
-
219
-
220
-
221
-
222
-
223
-
224
-
225
-
226
-
227
-
228
-
229
-
230
-
231
-
232
-
233
-
234
-
235
-
236
-
237
-
238
-
239
-
240
 |
 |

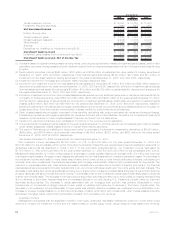
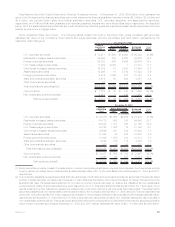
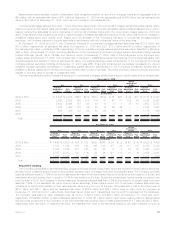
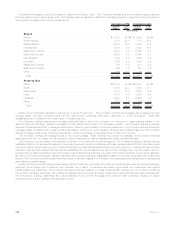
The following tables present the cost or amortized cost, gross unrealized loss and number of securities for fixed maturity and equity
securities, where the estimated fair value had declined and remained below cost or amortized cost by less than 20%, or 20% or more at:
Less than
20% 20% or
more Less than
20% 20% or
more Less than
20% 20% or
more
Cost or Amortized
Cost Gross Unrealized
Loss Number of
Securities
December 31, 2008
(In millions, except number of securities)
Fixed Maturity Securities:
Less than six months . . . . . . . . . . . . . . . . . . . . . . . . . $32,658 $48,114 $2,358 $17,191 4,566 2,827
Six months or greater but less than nine months . . . . . . . . 14,975 2,180 1,313 1,109 1,314 157
Nine months or greater but less than twelve months . . . . . 16,372 3,700 1,830 2,072 934 260
Twelvemonthsorgreater....................... 23,191 650 2,533 415 1,809 102
Total .................................... $87,196 $54,644 $8,034 $20,787
Equity Securities:
Lessthansixmonths ......................... $ 386 $ 1,190 $ 58 $ 519 351 551
Sixmonthsorgreaterbutlessthanninemonths........ 33 413 6 190 8 32
Nine months or greater but less than twelve months . . . . . 3 487 — 194 5 15
Twelvemonthsorgreater....................... 171 — 11 — 20 —
Total .................................... $ 593 $ 2,090 $ 75 $ 903
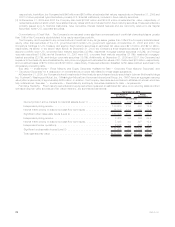
Less than
20% 20% or
more Less than
20% 20% or
more Less than
20% 20% or
more
Cost or Amortized
Cost Gross Unrealized
Loss Number of
Securities
December 31, 2007
(In millions, except number of securities)
Fixed Maturity Securities:
Lessthansixmonths........................... $ 46,343 $1,375 $1,482 $383 4,713 148
Six months or greater but less than nine months . . . . . . . . . 15,833 14 730 4 1,028 24
Nine months or greater but less than twelve months . . . . . . . 8,529 7 492 2 586 —
Twelve months or greater . . . . . . . . . . . . . . . . . . . . . . . . 29,893 50 1,162 13 2,692 32
Total...................................... $100,598 $1,446 $3,866 $402
Equity Securities:
Lessthansixmonths........................... $ 1,757 $ 423 $ 148 $133 1,212 417
Six months or greater but less than nine months . . . . . . . . . 528 — 62 — 154 —
Nine months or greater but less than twelve months . . . . . . . 439 — 54 — 62 1
Twelvemonthsorgreater ........................ 511 — 52 — 90 —
Total...................................... $ 3,235 $ 423 $ 316 $133
The Company performs a regular evaluation, on a security-by-security basis, of its investment holdings in accordance with its
impairment policy in order to evaluate whether such securities are other-than-temporarily impaired. One of the criteria which the Company
considers in its other-than-temporary impairment analysis is its intent and ability to hold securities for a period of time sufficient to allow for
therecoveryoftheirvaluetoanamountequaltoorgreaterthancostoramortized cost. The Company’s intent and ability to hold securities
considers broad portfolio management objectives such as asset/liability duration management, issuer and industry segment exposures,
interest rate views and the overall total return focus. In following these portfolio management objectives, changes in facts and circum-
stances that were present in past reporting periods may trigger a decision to sell securities that were held in prior reporting periods.
Decisions to sell are based on current conditions or the Company’s need to shift the portfolio to maintain its portfolio management
objectives including liquidity needs or duration targets on asset/liability managed portfolios. The Company attempts to anticipate these
types of changes and if a sale decision has been made on an impaired security and that security is not expected to recover prior to the
expected time of sale, the security will be deemed other-than-temporarily impaired in the period that the sale decision was made and an
other-than-temporary impairment loss will be recognized. See “— Summary of Critical Accounting Estimates — Investments.”
At December 31, 2008 and 2007, $8.0 billion and $3.9 billion, respectively, of unrealized losses related to fixed maturity securities with
an unrealized loss position of less than 20% of cost or amortized cost, which represented 9% and 4%, respectively, of the cost or amortized
cost of such securities. At December 31, 2008 and 2007, $75 million and $316 million, respectively, of unrealized losses related to equity
securities with an unrealized loss position of less than 20% of cost, which represented 13% and 10%, respectively, of the cost of such
securities.
At December 31, 2008, $20.8 billion and $903 million of unrealized losses related to fixed maturity securities and equity securities,
respectively, with an unrealized loss position of 20% or more of cost or amortized cost, which represented 38% and 43% of the cost or
amortized cost of such fixed maturity securities and equity securities, respectively. Of such unrealized losses of $20.8 billion and
$903 million, $17.2 billion and $519 million related to fixed maturity securities and equity securities, respectively, that were in an unrealized
loss position for a period of less than six months. At December 31, 2007, $402 million and $133 million of unrealized losses related to fixed
91MetLife, Inc.